Responding to the latest issue of the Coronavirus (Covid-19) Infection Survey, Peter Shreeve, Assistant District Secretary of the National Education Union said:
“This survey is of great concern. It confirms the worries of the NEU and many others that this lockdown has not been strict enough.
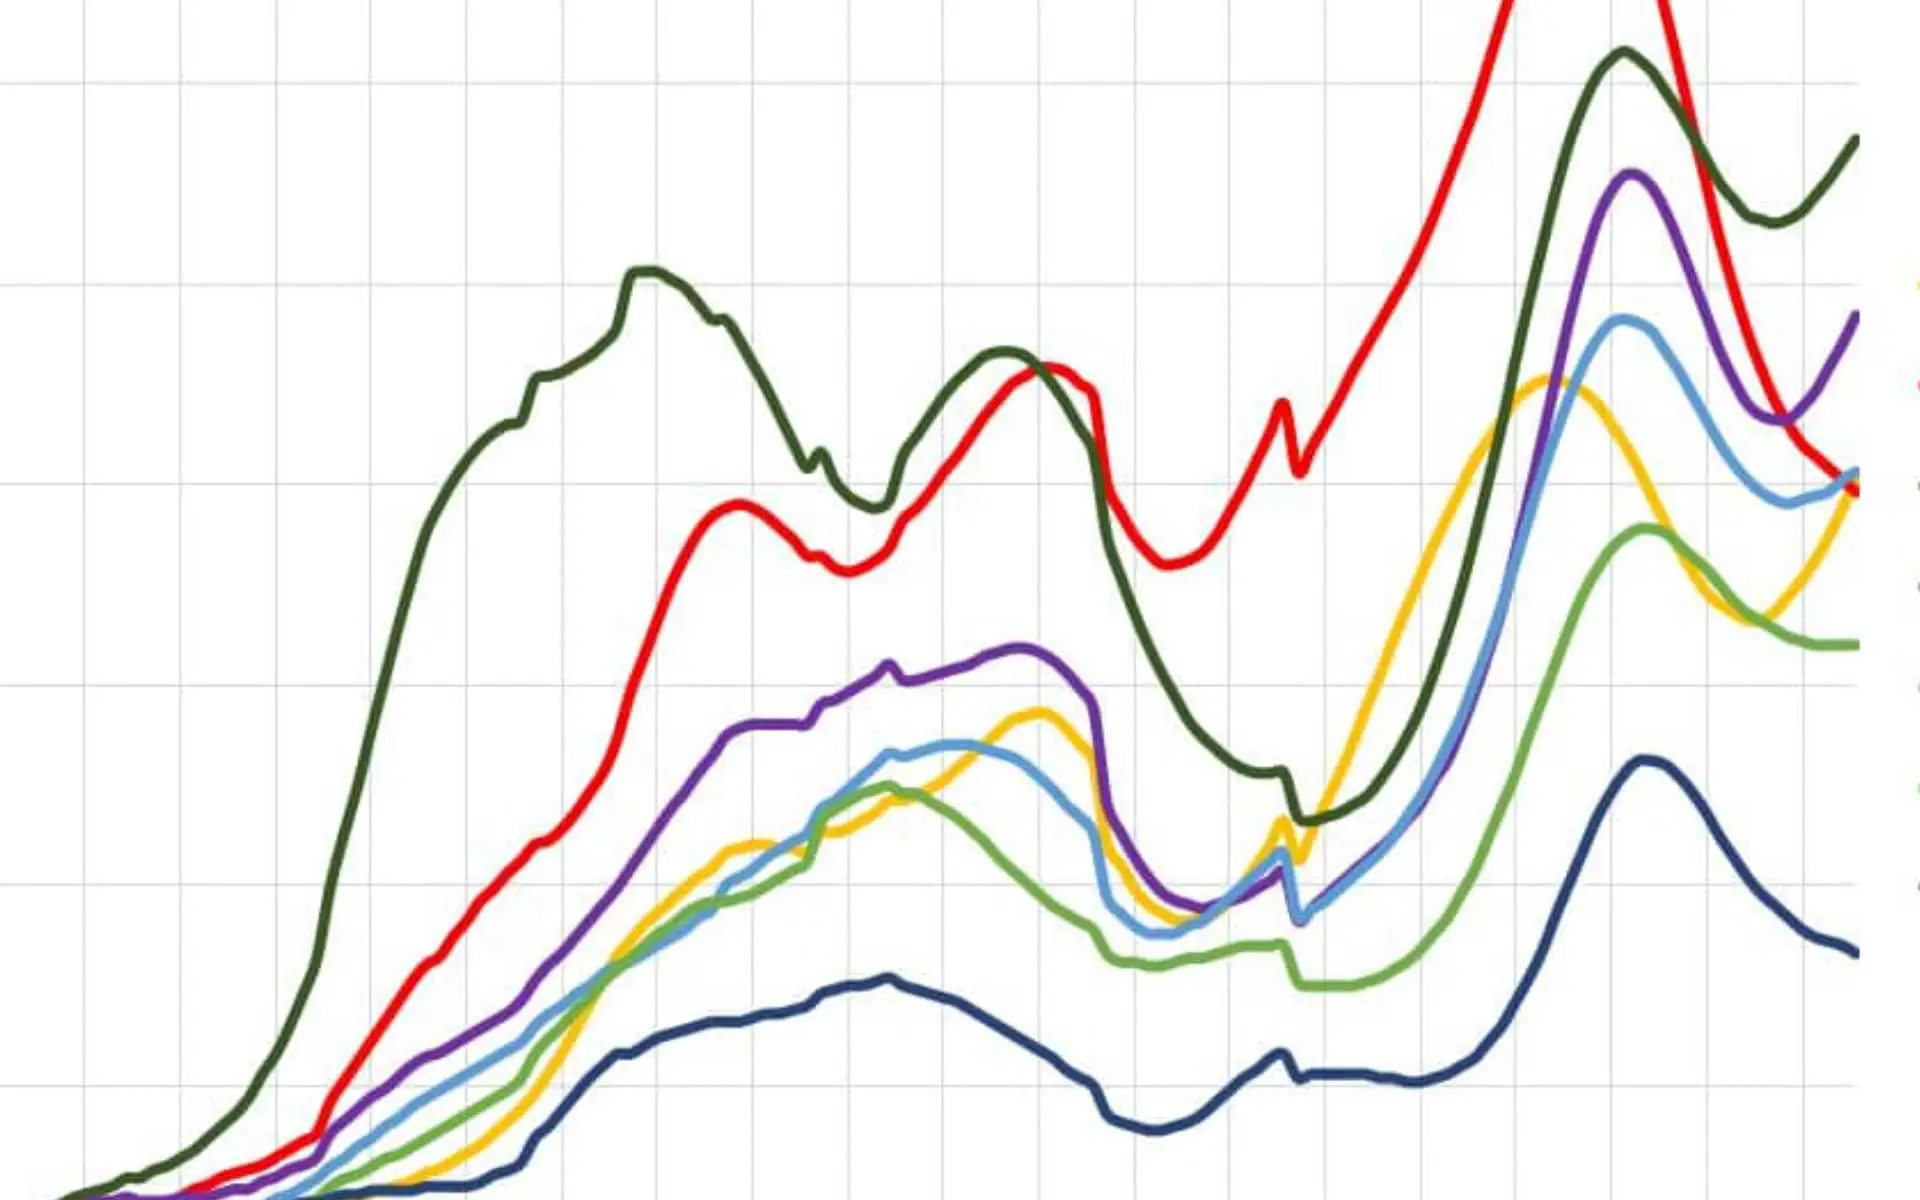
“It is not surprising that Coronavirus is back on the rise and that it is rising fastest amongst primary age pupils.
“Nurseries are open to all pupils and a fifth of primary pupils are being taught in school. During the lockdown last Spring, less than 1 in 50 pupils were being taught in school.
“It is welcome that coronavirus infection amongst secondary pupils is falling and this is because only 1 in 25 secondary pupils are being educated in school. However, we should not forget secondary school infections are still 50 times higher than the start of September.”

Attendance five times higher in third lockdown
He finished by saying,
“As attendance in state schools is five times higher in this third lockdown compared with the first, it is hardly surprising that schools being opened is associated with more cases.
“Independent SAGE pointed out in their weekly Friday presentation (22/1) that pupil attendance is now 21% in primary, 5% in secondary and 30% in special schools. This compares to 4%, 1% and 8% in the first lockdown.
“Attendance in state schools is significantly higher in this third lockdown. The Government cannot continue to ignore this report and must act to stop the role of schools in the transmission of Coronavirus.”
see also
Spreadsheet: https://www.dropbox.com/s/4mnf7gfxfa6ecm9/ons_infection_survey_by_age_20210122.xlsx?dl=0
Chart: https://www.dropbox.com/s/sqt4slo3u5bu95h/coronavirus_age_chart_20210122.JPG?dl=0