The Annual Report of Her Majesty’s Chief Inspector of Education, Children’s Services and Skills 2017/18
Published 4 December 2018
Applies to England

© Crown copyright 2018
This publication is licensed under the terms of the Open Government Licence v3.0 except where otherwise stated. To view this licence, visit nationalarchives.gov.uk/doc/open-government-licence/version/3 or write to the Information Policy Team, The National Archives, Kew, London TW9 4DU, or email: psi@nationalarchives.gov.uk.
Where we have identified any third party copyright information you will need to obtain permission from the copyright holders concerned.
This publication is available at https://www.gov.uk/government/publications/ofsted-annual-report-201718-education-childrens-services-and-skills/the-annual-report-of-her-majestys-chief-inspector-of-education-childrens-services-and-skills-201718
Presented to Parliament pursuant to section 121 of the Education and Inspections Act 2006.
Ordered by the House of Commons to be printed 4 December 2018.
Clive House
70 Petty France
SW1H 9EX
4 December 2018
Rt Hon. Damian Hinds MP
Secretary of State for Education
Sanctuary Buildings
Great Smith Street
London
SW1P 3BT
Dear Secretary of State
The Annual Report of Her Majesty’s Chief Inspector 2017/18
I have pleasure in presenting my annual report to Parliament, as required by the Education and Inspections Act 2006.
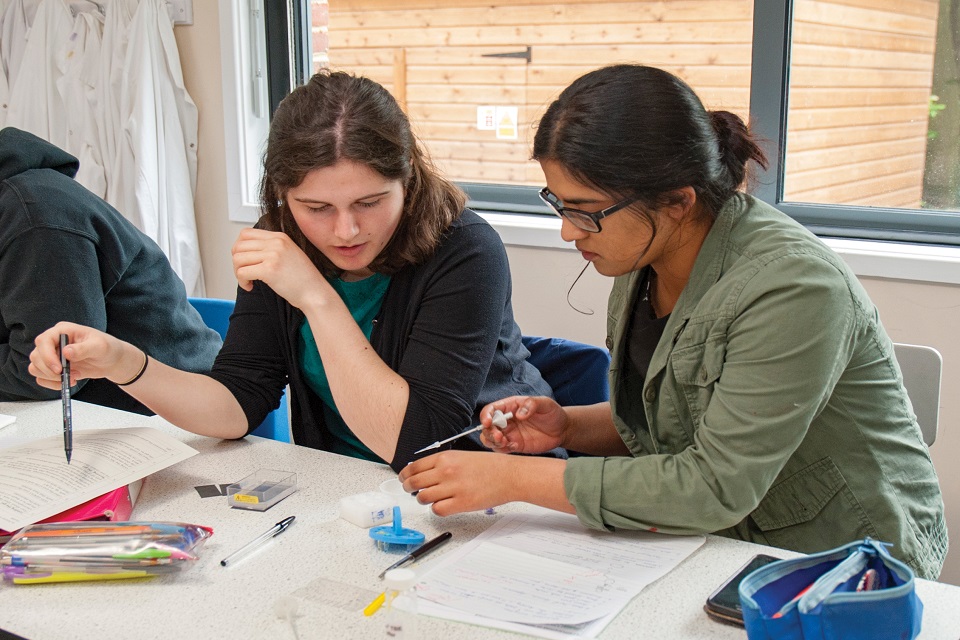
This report addresses the full range of our inspection and regulation both in education and care. It is underpinned by evidence from over 30,000 inspections of and visits to schools, colleges and providers of social care, early years and further education and skills. I also draw on findings from our research and analysis this year.
As before, our aim is to be a force for improvement. As Chief Inspector I am entirely committed to supporting improvement and raising standards for children and learners, regardless of their circumstances or where they live in the country. In this report, as in other aspects of our work, I aim to recognise success but also to direct attention to areas where improvement is needed.
We should be proud of the achievements of all the many professionals who have this year delivered a good, and often improving, standard of education and care. It is with pleasure that I can report that in some areas that we inspect, more of the provision available is good or outstanding this year compared with last. This continues the general trend of improvement that we have seen for a number of years.
I trust that this report will provide useful evidence to inform policies aimed at securing the very best futures for our children and learners.
Copies of this report will be placed in the Libraries of both Houses.
Yours sincerely
Amanda Spielman
Her Majesty’s Chief Inspector
HMCI commentary
In this section:
This is my second Annual Report as Her Majesty’s Chief Inspector.
The education and care sectors have been criticised for lagging behind their counterparts in health or even criminal justice for not making enough use of evidence and research to improve their practice. That criticism may have been valid in the past, but our inspections and conversations this year show that this is now far from the truth.
I have been struck by how enthusiastically teachers, lecturers and social workers are discussing and debating how to improve their practice on the back of evidence-based research, including Ofsted reports and surveys.
I have seen a really positive response to the focus we are bringing on the substance of the education – the curriculum. Across all the sectors we inspect and regulate, there is a real understanding that we need to regain our focus on substance: to teach an academic curriculum, to improve social care practice, to open up a range of future careers to young people.
We know that there are different gradients on the path to success in our system, with the most advantaged on the gentler incline. Each time we fail to teach a child to read, or fail to spot neglect, or assume that a child cannot study academic subjects or do not offer a good vocational pathway, we make the gradient they have to climb that bit steeper when we should be making it gentler.
The good news is that, across the sectors we inspect, we see people working well to deliver for young people. As a result, more providers are getting more of the basics right and, as a result, are improving.
- The early years sector remains strong, with 95% of providers judged good or outstanding compared with 74% 6 years ago.
- Eighty-six per cent of schools were judged good or outstanding at their most recent inspection. However, around 490 schools have been ‘stuck’ in a cycle of poor performance since 2005.
- Sixty-nine per cent of all non-association independent schools are currently judged good or outstanding. Although broadly the same as last year, this is a decline from August 2015.
- Seventy-six per cent of all general further education (FE) colleges are currently judged good or outstanding – a big improvement from last year.
- The number of local authorities (LAs) judged good or outstanding for their social care continues to rise, while two-thirds of LAs that were once judged inadequate have improved at re-inspection.
That paints a positive picture for much of the country. However, gaps remain. There are some children who may have never had the opportunity to attend a good or outstanding school in the whole course of their education. There are children who attend unregistered schools where British values are disregarded. There are children who are not being given the care they need in order to be safe.
We know that when we focus on an area for improvement, sectors respond and make changes. This year, we report on those areas most of concern. These are the areas that will require action on the part of policy makers, professionals and Ofsted.
- Literacy is the key to success in a rounded, academic and vocational education. Schools that understand this both read to children and teach phonics really well. They help the children whose parents have poor literacy, the children who start school with poor vocabulary, the children who find learning to read that bit harder than their peers. These schools address the imbalance.
- In the second year of our local area SEND inspections, we have seen a continuing lack of coordinated 0–25 strategies and poor post-19 provision. We have seen a continuing trend of rising exclusions among children and young people with special educational needs and/or disabilities (SEND). Mental health needs are not being supported sufficiently. The quality of education, health and care (EHC) plans is far too variable. Critically, the gap in performance and outcomes for children with SEND is widening between the best and the worst local areas.
- For the second year running, we are concerned about the small but persistent group of ‘stuck’ schools – schools that have not improved enough over many years. This year, we have identified around 490 schools judged to require improvement or be inadequate in every inspection they have had since 2005. We need more outstanding schools and school leaders to help these stuck schools.
- In the FE sector, the new apprenticeship levy and the merger of several colleges is changing the sector considerably. With the increase in new apprenticeship providers, we are concerned about the potential for a dilution in the quality of apprenticeships being offered. We are also concerned about access to apprenticeships for the third of students who leave school without a full level 2 qualification each year.
- We are seeing an impact of the reduction in LA funding. Although statutory social care services have been largely locally protected, reductions in funding in other areas are leaving LAs unable to intervene early enough when young people present as needing help.
- We continue to have serious concerns for the pupils who are being educated in unregulated settings that circumnavigate legal loopholes in order to operate. Children in these settings are being denied the education and opportunities they are entitled to. Some are at risk of radicalisation. The first successful prosecution of an unregistered school led to convictions in October this year. However, legislation needs to be strengthened so that these settings can be closed down and others deterred from operating them.
- Too many non-association independent schools have been inadequate for too long and do not have the capacity to improve. Current timescales for regulatory or enforcement action mean that pupils are spending significant parts of their education in schools where they are not learning well or are unsafe.
- This year, we have raised our concern about outstanding schools being exempt from inspection and the consequent gaps in our knowledge about the quality of education and safeguarding in these schools. For the outstanding grade to maintain its reputation, the exemption needs to be lifted and Ofsted needs the resource to inspect these schools.
- There is a shortage of specialist mental health provision, and the provision that exists is not distributed evenly around the country. This puts pressure on LAs to find the right places for the most vulnerable young people. It also puts Ofsted as regulator in a difficult position because we know that sometimes LAs need to give a child a home and keep them as safe as possible in a setting that might be unregulated and sometimes unregistered. The whole sector needs to offer better provision to these children.
- We have identified around 300 schools with ‘exceptional levels’ of pupils coming off-roll between Years 10 and 11. We know that the most vulnerable children are more likely to be excluded or off-rolled. The new education inspection framework (EIF) will allow us to identify and report on those schools that push young people who might achieve less well out of their schools through off-rolling.

Getting the basics right
It is often tempting to reach for new ideas or complex interventions to improve outcomes for children. But evidence from our inspections across all our remits is that the core of success for providers – what makes most difference for young people – is getting the basics right.
Early reading
It is hard to overstate the importance of early literacy. Reading is the gateway to almost every other subject, and to children discovering their own unique interests and talents. For that reason alone, ensuring that children master literacy is a central issue of social justice.
Children with poor literacy do worse at school. Young adults with poor literacy will struggle to get the best jobs. Nearly half of the people who end up in prison[footnote 1] have literacy skills no better than an average 11-year-old. And parents with poor literacy are less well equipped to help their own children, creating an unfortunate cycle in which disadvantage and lack of opportunity in one generation are replicated in the next.
Furthermore, not all children start school from the same place. More than a quarter (28%) of children leave Reception without at least the expected levels of communication, language and literacy.[footnote 2] Some have little or no English; some have never been read to; some will find it harder than others to learn to read, for a whole variety of reasons. Learning to read is the single most important purpose of the first year at school, most of all for the most disadvantaged children.
Schools that excel in the Reception Year understand these dynamics. They know that the more gaps open up between the achievement of the fastest and the slowest, the less likely it is that the slowest will ever catch up. They know that reading to young children in school, building their vocabulary and their knowledge of language, is a proven contributor to achieving good literacy for all children. They read to children, they teach phonics well and they give children time to practise and consolidate their growing knowledge. They understand the importance of play as part of the curriculum. But at the same time they understand which parts of the Reception Year curriculum should be taught directly and which can be developed through play. These approaches give children who start further behind the chance to catch up.
The phonics screening check has had a strong impact on children’s reading progress. The proportion of pupils meeting the expected standard has risen from 58% to 82% over the last 6 years. However (as ministers have said), the percentage of pupils reaching the expectations in the phonics check varies considerably, particularly for children who are eligible for free school meals (FSM). The data shows that in some economically deprived areas – for example, Newham in London and Newcastle upon Tyne in the North East – children eligible for FSM perform much better than in more affluent areas such as West Berkshire. These differences are particularly stark for boys who are eligible for FSM. In Newham, 80% of boys who are eligible for FSM achieve the expected standard in the phonics screening check compared with West Berkshire, where only 51% of the boys eligible for FSM reach it.
Newham shows, year after year, what can be achieved when schools focus on teaching children to read systematically from the very beginning. However, it is clear a renewed focus on phonics may be needed in some schools and LAs.
We intend to strengthen our focus on the inspection of reading. The results from some recent inspections have uncovered schools that are not teaching phonics and reading successfully, where many pupils read below age-related expectations, and where pupils do not become confident, fluent readers before they leave primary school. This is a concern. We will continue to evaluate the results from inspections over the next few months and, if they continue to show a similar picture, we will place a strong focus on the teaching of reading to the lowest 20% pupils in the EIF in 2019.
English and mathematics in further education
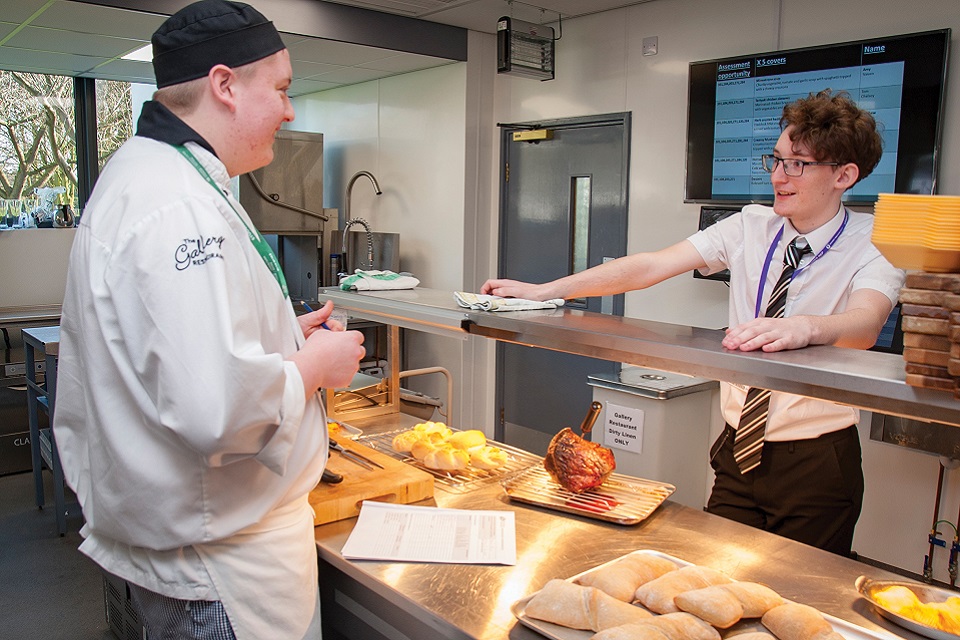
The focus on the basics should not stop at Reception, but instead needs to extend right through to the other side of the education system, in further education (FE) colleges, apprenticeship providers and community learning and skills providers.
Getting the basics of English and mathematics right is clearly important for young people entering the world of work. In our research on level 2 study programmes, we asked employers to identify the skills they felt young people lacked. Good spoken English and basic numeracy/literacy came up most frequently, ahead of confidence. Far from being important just to those who decide to follow an academic track, English and mathematics are the 2 subjects with the most impact on employability that young people can study. It is difficult to succeed in the 21st-century economy without being competently literate and numerate.
Although we have seen some further education colleges that are providing good, discrete English and mathematics programmes, an alternative and sometimes more successful strategy is to improve English and mathematics within the context of further technical and vocational study post-GCSE. Some colleges have even used English and mathematics teachers to train vocational teachers on how best to teach them within their courses.
Encouragingly, our research into level 2 study programmes showed that students in colleges felt that their English and mathematics had improved ‘a fair amount’ (8 out of 10) or ‘a lot’ (1 in 4).
However, we continue to be worried about the effectiveness of the government’s policy to require learners who have not achieved a grade 4 in English and/or mathematics to continue studying for a qualification in these subjects. Resit pass rates are low, at 24% for English and 19% for mathematics,[footnote 3] and the impact of repeated ‘failure’ on students should not be underestimated. Rather than creating the perception that English and mathematics study in FE is a punishment for not getting a grade 4 at an earlier stage of education, it should instead be pitched as a core part of vocational training. Learners should be able to appreciate that improving their literacy and numeracy is about genuinely improving their knowledge and their prospects for further training and employability, rather than simply something to cram for in a test. Further thought also needs to be given as to whether colleges, as currently resourced, are able to give this area the investment it needs and deserves.
Improving social care
The local authorities (LAs) that are most successful in supporting children are those that have got the basics right. Encouragingly, we have seen this year more of the social care sector doing just that.
The judgement profile from the single inspection framework (SIF), which showed that only 36% of LAs were rated good or outstanding at their first SIF inspection, was a wake-up call to everyone involved in children’s services. In January this year, we introduced new inspections of local authority children’s services (ILACS). ILACS allow us to look at how well local authorities support and protect vulnerable children in their area. The new approach is more proportionate, risk-based and flexible than before and allows us to prioritise inspection where it is most needed. The ILACS programme better enables us to focus on those areas of LA provision where there may be concerns, allowing us to ‘catch’ underperforming children’s services before they fall, rather than reporting on failure afterwards.
Reassuringly, we have seen a decrease in the number of inadequate LAs and around 60% of all LAs inspected have improved their grading. Again, LAs that were inadequate and have improved have done so by getting the basics right. None of this is rocket science. Leaders in these LAs:
- communicate a clear child-focused vision across the whole council and have ambitious plans that map out improvement
- have a deep understanding of frontline practice and children’s experiences and progress through an effective quality assurance system, including auditing, and access to timely performance information and feedback from children, families and staff
- prioritise and organise their improvement journey so that it is manageable and the pace of change is effective
- change their culture to one of high support and high challenge for staff, so that there is a learning culture where staff benefit from a sense of shared ownership and openness
- have corporate ownership and engage well with partners
- support social workers to work effectively, including continuously engaging with social workers and ensuring high visibility of leaders
- put the right ingredients in place to make social workers want to stay and to improve recruitment, such as providing them with good support, arranging training opportunities and career development and progression, ensuring manageable caseloads
- remain focused on doing the right things for children and families
The developing regional improvement alliances have the potential to provide a much more structured and targeted approach to improvement in the sector by the sector. Alongside the DfE’s investment in the Partners in Practice programme, this should build some capacity into the system.
This year, we found that the Children and Family Court Advisory and Support Service (Cafcass) had improved from good to be outstanding. They had consistently good practice across both public and private family law. We found exceptional, aspirational corporate and operational leaders working relentlessly to ensure that children and their families benefited from good or outstanding services. Listening to children, understanding their world and acting on their views were strongly embedded in practice. Leaders have worked diligently to develop and support a culture of continuous learning and improvement. The stability of leadership and strong aspirations to ‘get it right’ for vulnerable children were key factors in their success. Cafcass staff at all levels consistently provided excellent quality services for children, their families and the family courts.
Special education needs and/or disabilities review
However, increasingly, success in getting the basics right for one group of vulnerable children is not translating to getting it right for another. We are still seeing too many local areas providing a sub-standard service when it comes to SEND provision. At the end of our second year of LA SEND inspections, we have inspected 68 local areas. Thirty of these have been required to provide a written statement of action.
Frontline workers are clearly dedicated and professional, but improvement in many local areas is often slow and inconsistent. In particular, in the areas we visited, we are seeing:
- a continuing trend of rising exclusions among children and young people who have SEND
- mental health needs not being supported
- children and young people who have autism waiting up to 2 years to be diagnosed; some were not being educated at all during this time
- a continuing lack of coordinated 0–25 strategies and poor post-19 provision, which means some young people just doing the same things for 6 years more after age 19 and not moving into employment.
Education, health and care (EHC) plans are now in place. However, the quality of these plans is far too variable within some local areas and across the country, and contributions from care services to EHC plans are weak. The areas that have successfully implemented the government’s reforms are jointly commissioning services that support parents and lead to good outcomes for young people.
But many EHC plans have not been successfully implemented. As a result, the gap in outcomes for children with SEND continues to widen. Identification of SEND is weak and those who do not quite meet the threshold for an EHC plan have poor outcomes. Understandably, this leads to many parents feeling that to do the best for their children, they need to go to extreme lengths to secure an EHC plan, which of course not every child will need.
Secure estate
It should be a clear expectation that we get the basics right for children who enter the criminal justice system. For young offenders more than any others, secure provision should be about rehabilitation and offering them a second chance to succeed. As I made clear last year, if we fail to offer decent quality services to young people in secure training centres or young offender institutions, we may be passing a de facto life sentence.
Last year, we highlighted the disparity in inspection outcomes for secure children’s homes and secure training centres. That disparity remains. Ten out of 14 secure children’s homes remain good or outstanding, whereas all 3 secure training centres require improvement. Six of the 10 young offender institutions are also less than good.
This year, we have inspected secure children’s homes jointly with the Care Quality Commission (CQC). CQC’s involvement in these inspections has brought welcome health expertise to our work. CQC provides an informed view about the impact that health services have on progress and outcomes for children with the most complex needs. Inspections so far indicate that healthcare provision in secure children’s homes is good.
Inspections of secure training centres continue to reflect serious concerns about the experiences of children held in them. We remain concerned about high levels of violence and about the safety of children and staff, and about the understanding and management of risks and safeguarding procedures. If such a low quality of provision were being provided to children in mainstream education, it would be seen as a national scandal. The fact that these young people are marginalised should be no excuse to not provide them with the level of support and education they so desperately need in order to get their lives back on track. Our consultation on the future of secure training centre inspections has closed and we will be announcing any changes in February 2019.
Having the capacity to deliver
Delivering for young people – whether in an outstanding school, care home or training provider – requires the right resources, a qualified workforce and strong leadership. Without those 3 ingredients, young people can end up being failed. While we continue to see most institutions we inspect performing at a level that is good or outstanding, in too many of the remaining cases the capacity for improvement simply does not exist.
School leadership and workforce
Last year, we reported a small but persistent group of underperforming schools that have not improved enough over many years – in some cases for over a decade or more. We highlighted that there was a group of around 120 schools that required improvement, had not improved at their inspection in 2016/17 and had performed poorly for a very long time. This year, we have looked in more detail at the characteristics of a wider group of around 490 schools that we have judged as requires improvement, satisfactory or inadequate at every inspection since 2005. The detail of this work is in the schools chapter. It demonstrates that the cycle of poor performance continues. There are some children who may have been in a failing school for their whole time at secondary school.
The Department for Education’s (DfE) policy is to turn inadequate local authority schools into academies and to broker inadequate academies into a strong multi-academy trust (MAT) that is capable of improving the school quickly. This is asking a lot of the best MATs and school leaders, and leadership capacity in the school sector is worryingly thin. We are not seeing this matching of schools to MATs happen anywhere near as quickly as we would hope. In some cases, this has left local authority schools judged inadequate in limbo for over 18 months before they become an academy in a MAT.
While the number of system leaders continues to grow and programmes to build the capacity of MATs exist, we need many more outstanding schools and school leaders to step up to the challenge of providing system leadership. Partly, they are needed to take on and improve on the previous role of LAs in school improvement, some of which were failing the weakest schools and for all of which school improvement funding has been cut. We need more school leaders to give back to the system by collaborating and supporting struggling local schools, by becoming a system leader or forming a MAT. The current halfway house whereby all inadequate schools become academies and require a sponsor, but where there is a severe lack of capacity to sponsor them, has led to a mismatch in available support. Simply put, without more good sponsors, the DfE’s ambition to support failing schools will not be realised.
The DfE also needs to do more to grow system leadership capacity. It has funding available for school improvement and system leadership. It needs to set out clearly how it will fund school improvement services and incentivise the school-led system to take them up, particularly in areas currently with the weakest capacity.
As well as leadership capacity, perhaps the biggest challenges facing the schools sector are around recruiting and retaining teachers. A combination of an improving economy and a workload-exacerbated retention crisis has led to a shortage. The areas that struggle to recruit and retain teachers can often be the areas where we see the biggest educational challenges, creating a vicious cycle where the areas in most need have the most limited flow of talent and experience.
In October this year, the Secretary of State for Education, Damian Hinds, launched Opportunity North East, a programme to boost social mobility and raise aspirations for children. This initiative recognises the fact that the North East has one of the highest proportions of young people not in education, employment or training and had the lowest percentage of young people going to top universities in 2017.
We await the outcomes of this programme with interest and hope it succeeds in improving standards in that region.
Rapidly changing FE and skills sector
The last 2 years in the FE sector have seen developments for the introduction of T levels in 2020, a new way of funding apprenticeships through a levy, and college mergers. As we foreshadowed in last year’s report, the FE and skills sector is undergoing sweeping structural changes as a result.
Within this context, performance overall for the sector has remained static. Of the just over 1,000 FE and skills providers we have inspected, 8 out of 10 were judged good or outstanding at 31 August 2018.
The new apprenticeship levy has contributed to a huge increase in the number of providers delivering apprenticeships, doubling the numbers of independent learning providers and employer providers.
While we fully support the government’s goal of boosting apprenticeship numbers, we are also seeing some early warning signs of a dilution of quality. Our new monitoring visits to some of these providers have shown common issues around poor governance, low-quality teaching and not enough time for off-the-job training. The people who suffer as a result are the apprentices themselves, who finish their programme without the knowledge and skills to succeed in the workplace.
At the same time as new, often small, providers spring up, some of the biggest providers continue to provide real cause for concern. We saw that one provider that had swiftly recruited apprentices over the past year was not providing apprenticeships that were fit for purpose. Apprentices were not learning anything new, they were just getting accreditation for knowledge and skills they already had. The majority did not even know they were an apprentice. There have been high-profile cases of mismanagement and significant falls in standards. In one case, the Education & Skills Funding Agency has terminated the provider’s contract. Until that point, the provider was receiving millions of pounds of public money.
Along with the sudden expansion in the number of providers offering apprenticeships, we continue to be concerned about access to apprenticeships for the third of students who leave school without a full level 2 qualification each year.[footnote 4] The number of under 19s starting an apprenticeship has been in decline for the last 2 years. Level 2 apprenticeship starts have declined from 78,500 last year to 62,000 this year.
In contrast, the number of learners starting a higher apprenticeship has been growing year-on-year since 2011/12, increasing by around 10,000 apprentices a year for the past 4 years. We welcome more apprenticeships at higher levels, particularly when there is clear progression in an occupation from level 2 to degree level.
However, despite this rise in higher level apprenticeships, we are concerned that in many cases, levy money is not being spent in the intended way. We have seen examples where existing graduate schemes are in essence being rebadged as apprenticeships. This might meet the rules of the levy policy, but it falls well short of its spirit. We hope that government will give greater thought as to how levy money can be better directed at addressing skills shortages.

Funding pressures in FE
While schools have largely been protected and early years has seen significant new investment, FE has borne the brunt of austerity when it comes to education. In September, in its annual report on education spending, the Institute for Fiscal Studies (IFS) reported that spending per student in an FE or sixth form college is now 11% lower than for pupils in a secondary school, having been 50% greater in FE at the start of the 1990s, rightly reflecting the higher costs of provision.
We are concerned about the financial sustainability of the college sector, and the clear impact that real-term cuts to FE funding can have on provision.
Inspection evidence, our published reports and our insights indicate several areas in which some colleges are having to make cutbacks. These include a reduction in: the number of teachers, trainers and/ or support staff; teaching hours allocated to some courses; and the range of courses and enrichment activities offered to students. These concerns are reflected by the number of colleges that are currently in financial intervention.
Where colleges have improved their Ofsted grade this year, good financial management has been at the heart of that improvement. Fifteen of the 18 general FE colleges that improved to good this year have done so at least in part because they are thinking strategically about financial planning, their governance is robust and spending is focused on improving quality.
It is understandable that colleges are trying to recruit as many students as possible. However, we are concerned about the number of courses on offer that do not have good local employment prospects for learners. In our research on level 2 (lower level) study programmes, we found that art and media courses were generally perceived by colleges to have the least chance of resulting in employment within those industries. However, at least 3 of the colleges we surveyed reported these courses as having the most applicants, and our study of college websites showed some colleges overstating the potential for students to go on to work in that industry. Colleges should be realistic with potential applicants about which courses are most likely to lead to good jobs.
Social care funding and workforce
In social care, although LAs have had the most significant reductions across the public sector, statutory social care children’s services have, to date, largely been locally protected, which is welcome. However, reductions in funding in other areas, such as preventative and wider children’s services, mean that LAs are less able to intervene early, before young people need statutory services. The evidence suggests that these cuts to youth and other services are a false economy, simply leading to greater pressures elsewhere. More recently, LA leaders have begun to report unsustainable budget pressures in both adult and children’s social care. The recent experience of Northamptonshire should act as a cautionary tale of how the funding situation in local government, coupled with poor management, can lead to a rapid decline in the quality of children’s services.
We know that in the best performing LA children’s services departments, there are a number of essential success factors. One of these is workforce stability, both at the frontline and throughout the organisation. Stability of the most senior leaders is critical and changes of that senior leadership can be a precursor to deteriorating performance. Earlier this year, the Association of Directors of Children’s Services published a paper setting out their concerns about churn at the top of children’s services. We share their concern that during 2017/18 there was a 40% turnover rate of directors. While interim appointments can account for some of this, these changes represent the highest number of annual changes in a generation. There have, however, been some welcome improvements in the average length of tenure. This is occurring alongside high levels of agency staff in some LAs and the impact of increased spans of control, particularly those managers at the frontline. We recognise that government is seeking to invest through the practice leader and supervisor development programmes. The government has also committed resources to innovative projects to reduce numbers of children in care. As we reported last year, high caseloads inhibit the ability of professionals to deliver good-quality social work.
Communities and parents
Education and care services do not exist in isolation. They are and should be a central part of the communities they serve. That places a premium on these services striving for the right balance between addressing community-wide issues while serving their core purpose of educating and protecting young people. Over the past year, we have focused on a number of areas in which education and care providers have had to grapple with wider social challenges.
Neglect and child exploitation
In the last year, we have conducted joint targeted area inspections on the neglect of older children and on children at risk of exploitation.
When we looked at older neglected children, we found many examples of children being abused outside the family home, including being subject to exploitation. When we looked through the lens of exploitation, we found many children who had experienced abuse in the home, including suffering neglect.
The truth is that, while there has been a welcome focus in the public eye on tackling neglect of younger children, the same is not true as children get older. Indeed, because of the behaviours they can exhibit, older neglected children can at the same time be victims in need of support and doing harm to others. For that reason, a culture shift in how we understand and respond to the needs of older children is essential. If we do not address underlying trauma that children have suffered, we cannot help them to manage their behaviour. Neglect of older children may be more difficult to identify, because it is sometimes unseen. Often, the fact that they are older means that their basic needs as children for parental care and support are not addressed. Older children often come to the attention of agencies for reasons other than neglect, such as the child spending more time outside the home and therefore being vulnerable to exploitation or offending behaviour. In short, it is crucial that professionals recognise the vulnerability of older children and that they are still children who need parenting.
Knife crime and gangs
Attracting much attention in the media, and of growing concern to parents, has been the rise in knife crime and criminal exploitation of children across the country.
This year, we have studied knife crime in London, focusing on the role of schools in safeguarding children as well as educating them on the dangers that knife crime poses. We also completed 3 joint targeted area inspections of local authorities looking at criminal exploitation of children into gangs.
Schools are sometimes under pressure to be the silver bullet solution to all society’s problems. However, when it comes to knife crime and criminal exploitation of children, they can only do so much. Children are generally safe from knife crime at school, and schools can – and do – teach children about staying safe. Often, this includes staying safe from gangs and knife crime. That is their proper role.
Preventing knife crime more generally requires LAs, the police, health services, youth offending services and others to work together more effectively and consistently to disrupt and tackle criminal activity that is perpetrated by adults who exploit and cause harm to children.
School leaders, including heads of pupil referral units (PRUs), told us that they have seen increases in the number of children with SEND, younger children and girls being excluded in recent years. They also told us that all children are vulnerable to grooming by gangs and to becoming perpetrators and victims of knife crime. As such, all children need to be safeguarded.
It is unlikely that exclusion is ever a sole reason for children being groomed into gangs. But it is true that we need better information about pupils who are excluded or moved to other schools for gang or knife related reasons. Parents told us, for example, that gangs are sending children into schools with knives in their bags with the aim of getting them excluded to make them more vulnerable to more persistent grooming. Agencies, including schools, the police, LAs and community partnerships need to get better at sharing information about gang networks in order to safeguard these children and other pupils.
Local multi-agency partnerships must focus more on the risks of criminal exploitation, including county lines. Organised criminals are perpetrating horrific abuse and exploitation of children for their own financial gain. Local partnerships need to understand the scale of risk of criminal exploitation to children in their area, based on effective systems of gathering and sharing information within and between areas, so that patterns of exploitation and criminal activity and the impact on children are understood. They should have a highly coordinated, multi-agency and whole-council approach, building on some of the lessons learnt from tackling child sexual exploitation, as well as sharing good practice.
Obesity
There is no doubt that the rise in childhood obesity is one of the most acute crises of our time. By the start of primary school, almost a quarter of children in England are overweight or obese.[footnote 5] This rises to over a third by the time children leave primary school. There have been many calls for schools to be given more responsibility for reducing childhood obesity. However, our research found that, no matter what interventions schools put in place, there was no link between that and obesity rates in those schools. In short, there is no silver bullet – childhood obesity is an issue for society as a whole, not schools on their own.
Where schools can make a difference is by staying focused on their core purpose and teaching through the curriculum. Many primary schools are teaching children really well about healthy eating and living, which is their proper role as educational institutions. Around half of parents we surveyed said that what their children had been taught in school led them to make healthier eating and drinking choices outside school. More than half of pupils surveyed said that they were doing more sport and exercise as a result of what their school had taught them. However, as above, we saw no link between schools’ approaches to tackling obesity and children’s weight.
Schools could do more to listen to the views of children and parents, in particular on which extra-curricular activities to provide, but they should be considered as part of the wider personal development of young people, not a catch-all for tackling obesity. Teachers simply cannot take on the job of health professionals, nutritionists, parents and other new roles that are demanded of them on an almost daily basis. The answer to the obesity crisis lies in homes, communities, health services and schools acting in concert.
Toilet training
Even when it comes to very young children, we find that schools are being expected to pick up roles that should fall to the family. It is a startling fact that 70% of staff surveyed by the Association of Teachers and Lecturers (ATL) reported more children arriving in Reception unable to use a toilet compared with 2011.
This is a difficult situation for teachers typically with classes of around 30 children. It is disruptive for teachers and the other children, but it can also have a terrible social impact on the children affected. Nurseries and childminders should identify children who cannot use the toilet at the earliest possible opportunity and work with parents to help their children learn. But nurseries and childminders are not substitute parents. We cannot expect nurseries and childminders to do parents’ jobs for them, and neither can we expect schools. Parents have the most important role. Rather than expecting educational institutions to pick up the job of parents, parents must step up here. Only in the most extreme cases should parents be excused from being successful in this most basic of parenting skills.
Regulation and inspection powers
The education and care systems are never static. This means that both inspection and the wider accountability system must adapt to reflect change and newly emerging challenges. Ofsted has proved that it has the flexibility to meet such changes, and inspection practice has evolved significantly over the past 25 years. However, there now exist a number of legislative constraints that are impeding our ability to act as a force for improvement.
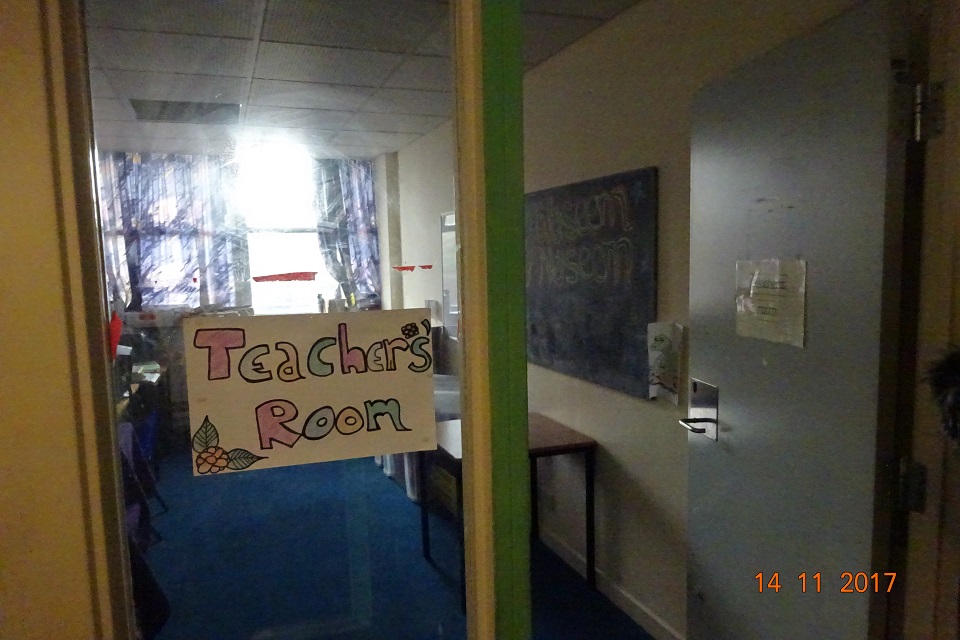
Unregistered schools
We have said for some time that we have concerns about pupils who are being educated in unregistered settings that can evade scrutiny of safeguarding practices and any assessment of the quality of education. Again, it is important for me to reiterate that our powers to intervene in these settings on behalf of young people remain too limited.
Many alternative providers are not required to be registered or inspected. Many of these providers offer a valuable service to pupils and schools, helping to re-engage marginalised young people. Some, however, do not and they are allowed to exist without consistent oversight or quality assurance. This provision may not be operating on a full-time basis but the children attending them may receive their full-time education by attending 2 or more alternative providers, none of which is inspected or required to meet a set of appropriate standards. It seems entirely perverse that mainstream settings are subject to a strict process of assurance while these institutions catering for some of the most vulnerable young people, who are most in need of high-quality provision, are not.
We do have some powers to intervene when settings are operating full-time as unregistered schools. We established our unregistered schools taskforce funded by the DfE in January 2016. We have received referrals of around 480 suspected cases.[footnote 6] We investigate every referral and have inspected around 240 settings where there was reasonable cause to believe that an unregistered school was operating.
In some of these settings, children are being taught by adults who have not had even the most basic checks of their suitability. Many of these settings are operating in buildings that are badly maintained or unsafe – in some cases, squalid. And while we have no powers to make assessments of the quality of education being provided, from our inspectors’ experience of visiting these types of settings, it is clear that the quality of education and pastoral support offered by providers is often not of the level that any child has a right to expect. Indeed, we have spoken to young people who have left these settings unable to read English and without basic mathematical skills. We also know that some of these settings are operated by those with fundamentalist religious beliefs. That means that children in these settings can also be at risk of radicalisation.
It is important that the government is able to prosecute those who run these settings that refuse to comply with the law.
In October, the first prosecution of an unregistered school was successfully brought against the Al-Istiqamah Learning Centre in Ealing. Inspectors found over 50 children of compulsory school age attending the setting, which continued to operate despite inspectors issuing it with a warning notice. This was a landmark case in which the courts recognised our serious concerns about these types of settings and sent a clear message to all those running them that, if needed, we will prosecute them.
In other cases, once Ofsted has detected these settings, they voluntarily close down or comply with the law. By August 2018, 13 settings had closed down, 8 registered and 31 changed their service to comply with current legislation.
While the unregistered schools taskforce has undoubtedly made good progress, too often we find that even where we have identified a setting that is putting children at risk, current legislation is too weak to allow us to close it down or prosecute the people running it.
Many institutions have learnt how to operate on the cusp of the law by exploiting loopholes in definitions of education. This is despite some settings, particularly faith settings such as yeshivas and madrasas, providing religious instruction for 5 and sometimes 6 days a week, from early in the morning to late into the evening. In these cases, it is perverse that the narrower the curriculum provision, the safer such a setting is from prosecution. Similarly, a lack of proper definition around what constitutes ‘full-time’ education allows providers to engage in a game of cat and mouse with our inspectors and to continue running these potentially dangerous institutions.
These settings have a significant and negative impact on the children who attend them, who do not have the opportunities other children have to develop academically, personally and socially so that they are ready and able to take their place in British society. We continue to urge the DfE to rapidly bring forward its proposals to strengthen the law in these areas.
Lack of regulation of independent schools
Our concerns are not, however, limited to unregistered settings. The performance of schools in the non-association independent sector remains a cause for concern, with many inadequate institutions. Since September 2015, 88 schools declined to inadequate, while 12 retained their inadequate rating.
Currently, the DfE’s current timescales for taking regulatory or enforcement action are too long, allowing for repeated cycles of inspections and submission of action plans before action is taken, even where it is clear that appropriate progress is and will not be made. In the worst cases, this means that pupils are spending significant parts of their education in schools where they are not learning well or are unsafe.
It is clear that many of these schools do not have the capacity to improve or to sustain improvement, which is why we welcome the fact that the department is consulting on a revised enforcement policy. But even when schools do improve, many subsequently fall back, leading to a recurring cycle of underperformance. We know that the DfE is also considering legislation to strengthen the regulatory regime in relation to schools in this position. We welcome that and look forward to progress being made soon.
We are further concerned that the present limitations on our ability to scrutinise the other inspectorates of independent schools, in particular the School Inspection Service, means that we are unable to properly discharge our statutory duty under section 107 of the Education and Skills Act 2008. While many inspections are doubtless carried out to a high standard, the system is currently not set up so that any problems with the quality of inspection can be spotted and tackled. This is particularly worrying in light of a number of serious safeguarding issues, both historic and recent, that have taken place at independent schools. We have made recommendations to the Secretary of State on how this system of oversight could be improved.
Outstanding school exemption
At the other end of the quality spectrum, we have this year voiced doubts about the continuing exemption from inspection for outstanding primary and secondary schools. Since 2011, outstanding schools have been exempt from routine inspection. As a result, some schools have not been inspected in over a decade. The rationale for introducing the exemption was sound, particularly as more was being asked of outstanding schools in supporting others. However, it has now served its purpose. Lengthy periods without inspection are unpopular with parents and even with teachers, 85% of whom agree that exemption should not be indefinite.[footnote 7] More importantly, the exemption leaves us with real blind spots as to the quality of education and safeguarding in these schools.
While some issues with outstanding schools will be caught in performance data, allowing us to trigger an inspection, others, such as curriculum narrowing, gaming and poor safeguarding practices, will not.
We have inspected 149 exempt outstanding primary and secondary schools this year. Overall, 67% of the 149 declined from outstanding. Of those schools that had their inspection converted to a full inspection, only 7 kept their outstanding grade, 55 declined to good, 35 declined to requires improvement and 10 declined to inadequate.
Some of the things we found in the schools that have declined from outstanding to inadequate are extremely worrying.[footnote 8] Safeguarding is typically not effective. In some schools, pupils feel unsafe or are frightened. In some, temporary exclusions are too high, and in one we found the illegal use of ‘extended study leave’ in place of exclusions. Teachers’ expectations are often far too low, particularly for disadvantaged and vulnerable pupils, leading to low levels of progress. Pupils with SEND are particularly poorly catered for in these schools. Governors often do not know what is happening on the ground, and staff do not get training, guidance or support from leaders. While we know that this is not reflective of the excellent work of the majority of outstanding schools, the fact is that without routine inspection there may be more problems like this that we simply do not know about.
The outstanding grade should be a symbol that a school is a beacon of excellence. If we are to maintain its reputation, the exemption from inspection for outstanding schools must be removed and Ofsted fully resourced to inspect those schools.
Unregistered and unregulated social care provision
It is equally important that regulation is not used as a blunt tool. When it comes to the most vulnerable young people, what matters most is finding the right place for them. We know that LAs often struggle to find the right place for those who have the most complex needs.
At any one time, there are a number of children waiting for a secure bed to become available, meaning that LAs are having to make difficult but pragmatic decisions about where children should live.
This can leave us as the regulator in a difficult position. If we identify provision that should be registered under the Care Standards Act 2000 then we have to take our responsibilities seriously, and we do. But we also know that LAs can equally be in the unenviable position, where ideal provision is not readily available, of having to ensure that they give a child a home and keep them as safe as possible.
The solution to this is for the whole sector to step up and offer homes to these children. The best providers know how to help the most vulnerable children. We will not and do not penalise them for doing so. We will, however, continue to act when children are placed in unsafe placements where their needs cannot be met.
There have been calls for Ofsted to regulate all provision, including that that does not currently require registration, such as supported living. On the face of it, this is a neat solution to concerns about quality and in the wake of some sad and tragic incidents. However, that must be weighed against the fact that regulation often has unintended consequences, in terms of cost and/or choice, and what some young people may see as a further intrusion into their lives. Introducing regulation in this sector would almost certainly mean that it would cost more for young people and those placing them in such accommodation and may result in some providers leaving the sector. We are not arguing against raising standards in this sector, but we are unconvinced that regulation is the solution. Ultimately, that is a matter for government to consider.
In the meantime, a first step would be for LAs to share a quality assurance framework and their experiences of good and poor providers in this area. We would also urge greater LA collaboration within and across regions. This would position the sector to further develop suitable provision for children with complex needs on a sustainable scale.
New approaches to inspection
In areas in which we do not face legislative constraints to adapting inspection practice, we have not hesitated to change our approach to provide effective scrutiny of the places where young people and learners are cared for, educated and trained.
Apprenticeship providers
With such a large increase in the number of providers delivering apprenticeships, concerns about quality were to some degree inevitable. We also know that whenever any significant new funding is injected into a sector, some unscrupulous providers will see an opportunity to make a quick profit. For that reason, to ensure the quality of the apprenticeships being provided, we must know where action is needed before people’s futures are compromised.
We have therefore introduced a new type of monitoring visit for providers receiving apprenticeship levy funding that have not previously been inspected by Ofsted. These visits let us judge whether providers are making significant, reasonable or insufficient progress in specific areas; these have allowed us to highlight any early problems. And we welcome the additional funding from the DfE to monitor all of the new apprenticeship providers. Alongside this, in response to feedback from the sector, we have also increased our inspection focus on subcontractors, the majority of which are providing apprenticeships. This allows us to take a holistic view of the quality of training from the learner’s perspective.
Inspection of local authority children’s services
The launch of our new ILACS framework in January this year allows us to take a more targeted and proportionate approach to inspection of local authorities. ILACS allow us to identify areas at greatest risk and focus our inspection activity on them.
Through ILACS, we have continued to explore the experience of care leavers in different local authorities and have been pleased to find an increasing number of LAs providing high-quality services for them. Access to accommodation has improved overall, and thanks to a concerted effort across the sector, bed and breakfast accommodation is generally now used only in very rare and exceptional circumstances.
However, while an increasing number of care leavers are in employment, education and training in some local authorities, NEET (not in employment, education or training) levels for this group remain too high, even where other areas of practice in the LA are strong overall.
With our single inspections of LAs, ILACS and relevant focused visits, we have also been focusing on arrangements for achieving permanence for children who are looked after, including adoption performance. We have seen strong practice in this area this year.
In the stronger LAs, senior leaders have demonstrated commitment to embedding the concept of permanence for all children across all parts of the council and with external partners. This means that children are more likely to gain prompt access to effective support such as help for their emotional well-being and access to the right schools.

Professionals in the highest performing LAs use a full range of permanence options in a timely way for children in care. This includes consistent use of ‘fostering for adoption’ and innovative use of wider family members, as well as special guardianship orders, adoption and long-term fostering. This means that more children safely remain with their parents or extended family. Timely ratification of long-term, permanent foster placements provides children with certainty about their future.
Multi-academy trusts
One area where our inspection powers have not kept pace with changes in education is for multi-academy trusts (MATs). MATs now generally take responsibility for making many significant decisions, not just about the financial management of schools but also what is taught in them and how it is taught and assessed. The fact that Ofsted is unable to inspect MATs directly means that parents and government are missing out on information about an important part of the evolving educational landscape. We look forward to engaging with the DfE as it develops the Secretary of State’s plans for greater MAT accountability.
Nonetheless, within the limitations of our existing powers, we have made changes that allow us to get a better handle on quality across a MAT. In December, following some targeted piloting and inspector training, we will be changing the process for reviewing MATs by introducing MAT summary evaluations. Building on our practice over the past 4 years, we will continue to inspect groups of schools in a MAT that are due to be inspected, but rather than doing so in a single week, these will be carried out across one or two terms.
That will allow us to conduct evaluations of MATs with the leaders once all those inspections are completed and the inspection reports are published, rather than the following week. This offers more time to draw out common themes and gives MAT leaders opportunity for reflection. In order to provide a balanced picture of quality in the sector, these evaluations will look at high-performing MATs as well as those where we might have concerns.
Substance of education
It is a well-worn adage that what is measured is what gets done, and that is particularly so in the provision of public services. We know that a strong accountability regime, combined with high levels of autonomy for professionals, is the route to higher quality and sustained improvement. However, where the accountability measure becomes the sole driver of a school, college or nursery’s work, their real purpose – to help young people learn and grow – is lost. We see evidence of this across all of the sectors we inspect.
Curriculum
The substance of education is the curriculum. It makes no sense to think about education without it. Yet in recent years that substance has lost out to performance tables and data in the priorities of many in the sector.
What is taught matters. It matters in early years, in schools and in further education, and all of us need to do more to return our focus to that real substance of education.
In early years, focusing on the substance means recognising the huge importance of early literacy, language and numeracy. In primary schools, it is about building that crucial foundation in English and mathematics, alongside a broad and balanced curriculum that imparts powerful knowledge across a range of subjects. In secondary schools, it is about ensuring that pupils are able to study the full breadth of the national curriculum in key stage 3, with the EBacc subjects as the foundation of key stage 4, allowing them to make informed choices for future work and study. In FE, it is about designing courses to best meet the needs of employers and supports learners onto the next stage of training or employment.
For our part, from September 2019, we will use the new EIF to rebalance inspection to take more account of what is taught. It has been heartening to see the welcome this approach has received in the sector. The framework will reward nurseries, schools and colleges that are doing the right thing by their children and learners, particularly the disadvantaged, and providing a rigorous education to all. It will move the focus of leadership away from progress data, arbitrary tracking of pupils’ scores and all the workload that those create for staff, and instead will allow teachers to get on with their core role: designing the curriculum, sequencing knowledge, ensuring mastery and improving learning: in short, teaching pupils and making sure they learn the right things.
Off-rolling
In addition to a focus on the quality of education, the EIF will allow us to identify and report on those schools that push young people who might achieve less well out of their schools through off-rolling. Our analysis has shown that off-rolling (see our definition) is a significant issue. Between January 2016 and January 2017, 19,000 pupils dropped off school rolls between Years 10 and 11 – that is 4% of pupils. Around half of that number did not reappear on the roll of another state-funded school. It seems unlikely that many parents would voluntarily choose to home-educate their children, or even send them to another school, in the middle of their GCSE courses, which is why the magnitude of these numbers is such a cause for concern.
The incidence of off-rolling is not evenly spread across the country. A higher proportion of schools in London are seeing movement of pupils compared with other areas of the country. We found that around a quarter of secondary schools nationally had ‘lost’ at least 5 pupils and more than 5% of pupils between Years 10 and 11. Three hundred of these schools had ‘exceptional’ levels of pupil movements for the last two years.
We know that some of the most vulnerable children – those with SEND, those eligible for free school meals, children looked after and some minority ethnic groups – are more likely to leave their school.
Any disruption in the midst of GCSE study is a cause for concern, but we are particularly concerned about pupils who disappear from school rolls entirely. Some parents tell inspectors on LA SEND inspections that an exclusion helps them to have their child assessed. Inspectors were also told by some that they have been asked to take their children out of school.
Following our work to identify schools with exceptional levels of pupil movement, we are tackling potential off-rolling by:
- using the data to help prioritise which schools to inspect
- providing data to inspectors when they are visiting schools with unusually high pupil movements
- producing guidance and training to our inspectors to help them to ask the right questions and look beyond the data
- analysing what we learn from visits to schools with exceptional levels of pupil movements, to further inform our practice
- using the data to ask questions in our meetings with LAs and MATs about the schools they oversee
Our new inspection framework will go further. The changes we are proposing will make it easier to recognise and reward good work done by schools for all children. By shifting our focus away from performance measures in isolation, we will empower schools to put the child first.
Physical development in early years
The pressures of performance tables and Ofsted are not the only things that can lead to providers compromising on the substance of their provision. The gold plating of regulations and, in particular, health and safety requirements can do much the same.
We know that in the early years, a crucial part of preparing children for school is developing their muscular strength and dexterity. The best nurseries recognise this and encourage children to be busy and active.
But we also know that in other settings this good practice is stifled by undue concerns about the risk and safety of such activities. While it is a basic expectation of any institution that cares for children to carry out proper risk assessments, some level of risk is an essential part of childhood. Without it, we stifle children’s natural inquisitiveness and their opportunities to learn and develop and deny them those opportunities to build that muscular strength and dexterity. We hope that nurseries and other childcare settings take a common sense approach to managing risk.
Initial teacher education
Our current initial teacher education (ITE) inspection framework, in place since 2012, has focused strongly on the outcomes achieved by ITE providers. Typically, all ITE providers now have high rates of trainees completing their courses successfully and gaining a teaching post within 6 months.[footnote 9] The time is right therefore to evolve the focus of our inspections. Over the next year, we will be doing research and talking to ITE partnerships to develop the next ITE framework. We will launch the next framework in early 2020, after launching the EIF in September 2019, to align the two. While maintaining a focus on outcomes, we will ensure that trainee teachers are prepared well to provide pupils with the deep knowledge they need to flourish in their education and future employment. The current framework has been extended for an additional year.
Children’s social care
Children’s social work is not a static profession. It is constantly developing in response to academic and practice research. The past few years have seen a huge increase in children’s services departments adopting a theoretical model of practice or embedding evidence-based practice in their work with children and families. Inspection evidence does not lead us to support any specific model, but when really well planned and carefully implemented, we have seen more focused assessments and interventions with families, drawing on their strengths while still providing the necessary prompt decision-making in children’s best interests.
Ofsted and the year ahead
Over the next year, we will seek to explore many of the themes we have discussed in this report further, and in particular focus on proven effective improvement measures. Our research programme will include projects looking at:
- practices that reduce workload and improve teacher well-being
- practices that are being used in education to manage the most challenging behaviour and their consequences
- what it can look like when schools with a declared faith successfully navigate potential conflicts between equality legislation and how they teach their beliefs and express them in their ethos and practices (in partnership with the faith inspectorates of religious education)
- physical development in the early years curriculum
- 16 to 19 curriculum
- curriculum knowledge and pedagogy in initial teacher education
- which factors lead to good decisions for children either in care or where care is a prospect
- creating the environments for great social work practice to thrive
- joint targeted area inspection: familial sexual abuse
- SEND in mainstream schools
In addition we will be working with the DfE to look at those schools that are ‘stuck’ at inadequate or requires improvement grades, and what they can do to improve, and we will be finding out more about off-rolling: its prevalence, the reasons for it and how we can prevent it. We will also be continuing to train our inspectors on sexual violence in schools and colleges, and will do more work to understand the scale of the problem.
In January, we will consult on the new education inspection framework. We will propose that the framework consists of 4 judgements focused on:
- quality of education
- behaviour and attitudes
- personal development
- leadership and management
We will also for the first time consult on handbooks for each of our individual remits – schools, further education and skills, early years and independent schools. This will give the sector a real opportunity to shape the future of inspection. The framework is being piloted throughout the autumn term 2018 to July 2019, with information and training sessions for schools running in parallel. Subject to the results of the consultation, we plan to implement the new framework from September 2019.
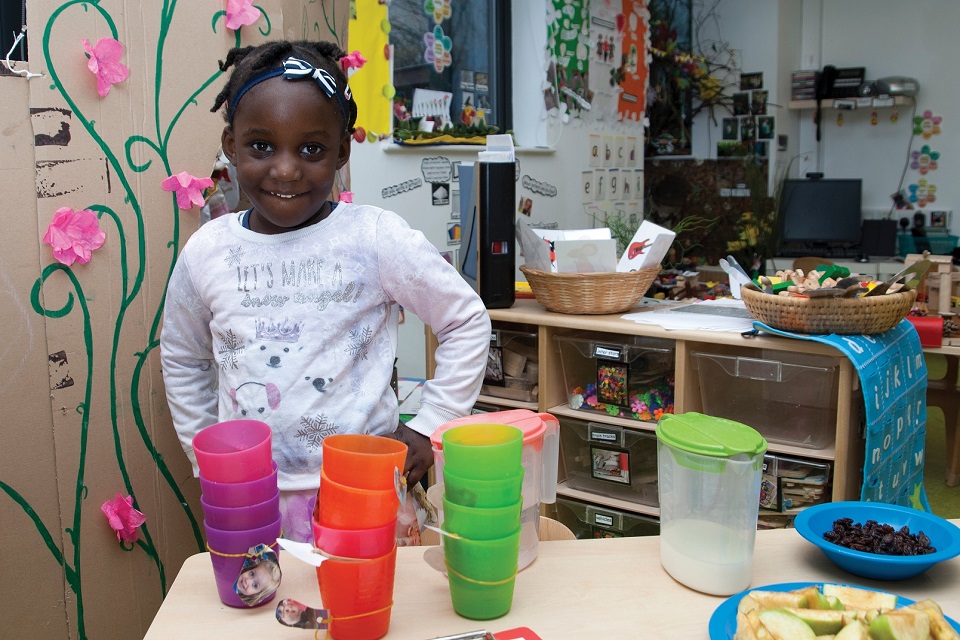
Early years
In this section:
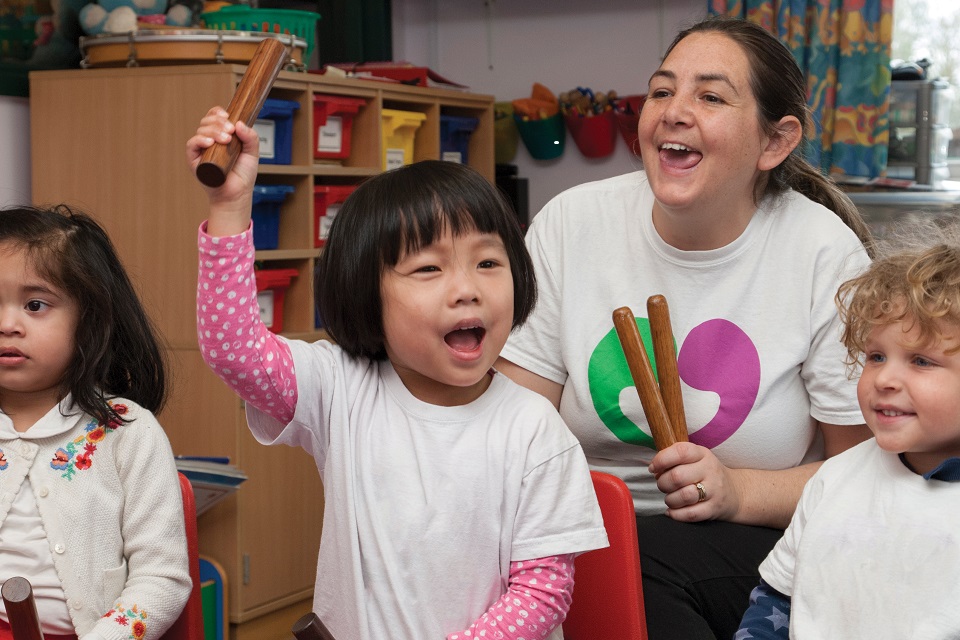
‘Early years’ refers to the care and early education of children between birth and 5 years old. This includes providers registered with us, such as childminders, nurseries and pre-schools.[footnote 10] Nursery schools and Reception classes also look after children aged between 2 and 5.[footnote 11]
Section overview
Inspection outcomes for providers on the Early Years Register (EYR) remain strong. More than 9 out of 10 were good or outstanding at their most recent inspection.
The total number of early years and childcare providers registered with us continues to decrease over time. This can be attributed to a large decrease in childminders and smaller decreases in the number of nurseries and pre-schools. However, the number of places in early years providers has remained relatively stable, at around 1.3 million.
Nurseries and pre-schools operating as part of a group under a single registration are more likely to be judged outstanding than those operating alone. The quality of provision is also linked to other factors, such as levels of local area deprivation.
On 31 August 2018, there were just over 78,900 early years and childcare providers registered with us. Of these, around 63,500 were registered on the EYR and subject to routine inspection.[footnote 12]
Figure 1: Number of early years providers as at 31 August 2018 and number of inspections carried out in 2017/18

Inspection outcomes
During 2017/18, we carried out over 14,700 full inspections of childcare providers registered on the EYR. We judged 86% of these providers as good or outstanding in their overall effectiveness.
On 31 August 2018, almost 51,200 (81%) providers on the EYR had received a full inspection. The remaining 19% were yet to be inspected: the large majority of these had joined the EYR within the last 2 years.
Of the providers on the EYR that had been inspected, 95% were judged good or outstanding at their most recent inspection. This has increased by one percentage point since 31 August 2017. It is a substantial increase from 74% on 31 August 2012, when we revised our previous inspection framework. Nursery schools also had exceptionally positive inspection outcomes: we judged 62% outstanding.
Figure 2: Overall effectiveness of early years providers at their most recent inspection, 31 August 2018

Looking at different provider types, 95% of nurseries and pre-schools, compared with 94% of childminders, were judged good or outstanding at their most recent inspection. Since 2012, the proportion of childminders judged good or outstanding has improved at a faster rate than nurseries and pre-schools. Therefore, the gap has narrowed by 7 percentage points.
A number of factors, including our inspection and registration policies, may have contributed to the rise in the quality of the early years sector over time.
- Changes to the statutory framework for the early years foundation stage (EYFS) in 2012 mean that childminders have to complete training before we can register them. This may have reduced the overall numbers of joiners over time, while improving the quality of those joining.
- Since November 2013, we have re-inspected all nurseries and pre-schools judged as requires improvement within 12 months. This means that these providers have been more frequently monitored and so have had the opportunity to improve sooner.
- Similarly, from August 2016, we have prioritised inspecting childminders that had previously been judged requires improvement.
We also found that the quality of early years provision differed between levels of local area deprivation, but the gap is narrowing. On 31 August 2018, the proportion of all early years providers on the EYR judged good or outstanding was highest for those in the least deprived areas (96%) and lowest in the most deprived areas (91%).[footnote 13]
The gap between the proportion of good and outstanding childminders in the least deprived areas compared with the most deprived narrowed by 9 percentage points in 6 years. For nurseries and pre-schools, the difference has fallen from 8 to 2 percentage points since 2012.
Figure 3: Proportion of providers on the EYR judged good or outstanding at their most recent inspection, by level of deprivation, 2012 and 2018

Childminder agencies were introduced in September 2014, enabling new childminders to choose to register with us or an agency. Childminder agencies have the responsibility of inspecting the childminders who are registered with them and we inspect these agencies.
We are required to inspect childminder agencies within 12 months of registering their first childminder, with subsequent inspections taking place within 36 months thereafter. There are only 2 possible inspection outcomes: ‘effective’ and ‘ineffective’. On 31 August 2018, 6 out of 11 childminder agencies registered with us had childminders on roll. We have inspected all 6 agencies and judged them all to be effective.
Providers and places
On 31 August 2018, the total number of early years and childcare providers registered with us was just over 78,900, a decrease of 18% since 31 August 2012. The fall is due to a large decrease in childminders (29%) and a smaller decrease in nurseries and pre-schools (2%).
Despite the fall in number of providers, the number of EYR places has remained at around 1.3 million since August 2012 (Figure 4). Nurseries and pre-schools have seen a slight increase in the number of places offered, which coincided with the introduction of the 30-hours policy in September 2017.[footnote 14] In January 2018, there were around 297,000 3- and 4-year-olds benefiting from a 30-hours place.
Figure 4: Early years and childcare providers and places on the EYR over time, by provider type

Although childminder provider numbers on the EYR have decreased by 30%, the number of places offered has only decreased by 12%. This means that individual childminders are offering a higher number of places on average.[footnote 15] The average number of places offered by childminders on the EYR was 6.4 in August 2018.
Complaints and notifications
All registered early years providers are legally required to notify us about certain events that may occur in a setting. These are referred to as ‘notifications’. We also receive complaints and concerns from other sources about things that are alleged to have happened in a setting. These are referred to as ‘complaints’.
In 2017/18, we received just over 21,800 complaints and notifications in relation to 13,200 providers. The number of complaints (11,000) was similar to the number of notifications (10,900). The large majority of cases were about nurseries and pre-schools.
We use the information we receive to identify the nature of the complaint or notification. Cases were most commonly about safeguarding and general suitable people matters. However, notifications were more likely to be about accidents or injuries.
Risk assessments are carried out when we receive information that may mean that a provider is not meeting the requirements for registration. The result is 1 of 3 outcomes:
- the issue is logged for consideration at the next routine inspection
- we carry out a full inspection of the provider within 7 days (known as a priority inspection)
- details of the incident are referred to the relevant regional regulatory team (known as regional action)
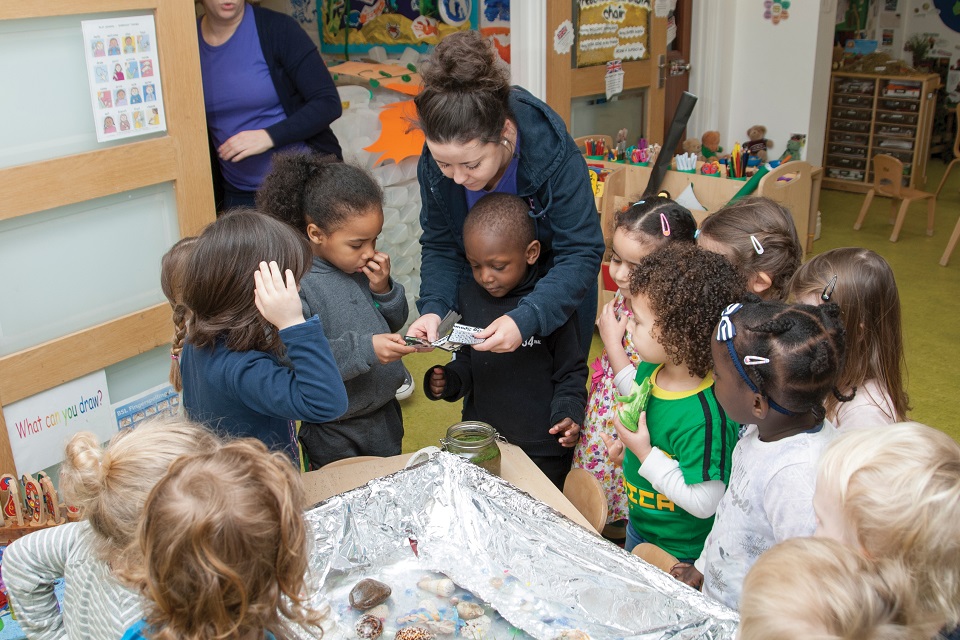
In the large majority of cases (70%), the issue raised did not require immediate action and we logged it for consideration at the provider’s next inspection. This outcome was most common in notifications from nurseries and pre-schools (Figure 5). By contrast, over half (57%) of complaints made about childminders were logged for regional action.
Figure 5: Outcomes of complaints and notification cases, by provider type

As expected, complaints were more likely to result in a rapid response than notifications, either by one of the regional teams or through a priority inspection. A more immediate response was also more likely for complaints about childminders than for complaints about nurseries or pre-schools.
Nursery and pre-school groups
Nurseries and pre-schools are associated with a registered person, which is the individual or organisation that runs the childcare. The majority of nurseries and pre-schools are standalone, but around 4 in 10 operate as part of a group under a single registration. We define a nursery and pre-school group as at least 2 nurseries and pre-schools on the EYR under the ownership of the same registered person.[footnote 16]
On 31 August 2018, there were more than 24,200 nurseries and pre-schools on the EYR. Around 9,760 of these were associated with just over 2,770 registered persons. Figure 6 shows the breakdown of nursery and pre-school groups by how many providers are in each.
Figure 6: Proportion of nurseries and pre-schools by the size of their associated nursery and pre-school group, 31 August 2018

The proportion of nurseries and pre-schools judged good or outstanding is similar across groups and those operating alone (Figure 7). However, there is a notable difference in the proportion judged outstanding for groups of 21 or more, compared with the rest.
Figure 7: Overall effectiveness of nurseries and pre-schools at their most recent inspection by group size, 31 August 2018


Schools
In this section:
We inspect more than 21,900 state-funded schools. Together, they provide education for more than 8 million pupils.[footnote 17]
Section overview
Thirty-six per cent of schools are now academies (including free schools), compared with 32% last year. While 7 out of 10 secondary schools are now academies, a similar proportion of primary schools are still under local authority (LA) control. There are over 1,100 multi-academy trusts (MATs), many of which are getting bigger because most new academies now join a trust from the outset.
Eighty-six per cent of schools were judged good or outstanding at their most recent inspection. This is a substantial improvement since 2010. However, a small group of schools have been stuck in a cycle of poor performance since 2005.
An important issue for the sector is that some pupils are being moved off the school roll because they may be seen as difficult to teach or likely to adversely affect the school’s performance data. This is known as ‘off-rolling’ and is in the school’s interest, not the pupils’.
Two years ago, we began inspecting how well local areas are meeting the needs of children and young people who have special educational needs. We have issued a ‘written statement of action’, an indication of serious failings, to nearly half of the areas visited.
This year, we carried out almost 6,890 visits to schools.[footnote 18] This includes 6,130 full and short inspections.
Figure 8: Number of state-funded schools as at 31 August 2018 and number of inspections carried out in 2017/18

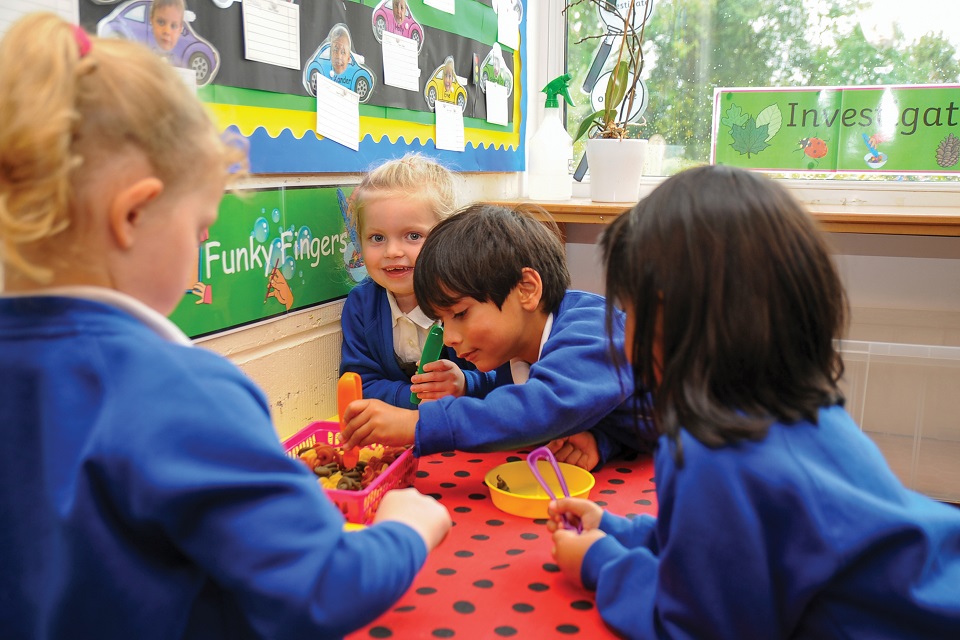
Inspections are carried out under a range of legal powers and for a variety of different reasons. For instance, we carried out:
- nearly 2,470 full inspections, which lead to graded inspection judgements, including:
- around 850 full inspections of schools previously judged to be inadequate or to require improvement
- around 540 full inspections of new academies that were having their first inspection as a new school
- nearly 3,980 short inspections of schools previously judged to be good or outstanding (including around 310 that became full inspections)
- almost 150 visits to outstanding primary and secondary schools, which are exempt from routine inspection but which we visited because we had some concerns[footnote 19]
- around 650 monitoring visits[footnote 20]
Inspection outcomes for state-funded schools
Of the 2,470 full inspections this year, 7% of schools were judged to be outstanding, 47% were judged to be good, 37% were judged to require improvement and 9% were judged to be inadequate.
When a short inspection did not convert to a full inspection, the school maintained its previous grade of good or outstanding. When these outcomes are included alongside the outcomes for full inspections, the overall mix of grades seen this year is much more positive. Six per cent of schools were found to be outstanding, 76% were good, 15% were judged to require improvement and 4% were judged to be inadequate.
By the end of August 2018, we had judged 86% of schools good or outstanding at their most recent inspection. There was little change from the position at the end of August 2017 (87%). Outcomes continue to be higher for primary schools (87% good or outstanding) than for secondary schools (75%).[footnote 21]
Figure 9: Overall effectiveness of state-funded schools at their most recent inspection, 31 August 2018

Looking at the implementation of the English Baccalaureate (EBacc) on inspection
It is the government’s ambition that 75% of pupils in state-funded secondary schools should be starting to study EBacc GCSE courses by 2022. In 2018, 38.4% of pupils entered the EBacc, an increase of 0.3 percentage points from 2017.
Since September 2018, as part of inspectors’ discussions with leaders about their vision for the curriculum and ambition for their pupils, inspectors ask school leaders whether they are aware of the government’s ambition and what they are doing to reflect this in their curriculum. Inspectors explore whether leaders have considered changes to the curriculum for 2018/19 and beyond. There is no benchmark or single route to the successful implementation of a curriculum with the EBacc at its core, although inspectors will evaluate how a school’s curriculum plans contribute to the government’s ambition.
Inspecting schools that cater for different age groups
There are some schools that pupils join and leave at unusual ages, for instance junior schools, middle schools, university technical colleges and studio schools. Performance information is only ever a starting point on inspection, but it is important that inspectors interpret this data correctly.
This year, both Ofsted and the DfE have made clarifications in the guidance that accompanies their datasets. These are to emphasise that pupils will not have been in these schools for the whole key stage and that this may influence their progress scores at the end of the key stage. We ask inspectors to consider a range of information and data, including the current pupils’ progress in all year groups. Expectations around EBacc entry rates are also different for some schools. The government’s ambition for all secondary schools is for 75% of pupils to be entered for the EBacc by 2022. However, this ambition specifically does not apply to university technical colleges and studio schools because they provide a specialist technical and professional education. These types of provision should decide on a case-by-case basis whether their specialist curriculum is compatible with entering pupils for the full EBacc.
Changes to our methodology for statistical reporting
In June 2018, following a consultation, we changed the way we report on inspection outcomes in our statistical datasets. The main change was to include the grades of schools that had since become academies in our statistics and analysis. These are called ‘predecessor schools’.
By including the inspection outcomes of around 700 more schools, our data is now more comprehensive and transparent. We have also back-dated the changes for previous years so that we can still compare the quality of the sector over time.[footnote 22]
The revised data shows a similar trend to that seen before we made these changes. The sector has improved substantially since 2010, when only 68% of schools were good or outstanding.
Figure 10: Overall effectiveness of state-funded schools at their most recent inspection, 2010 to 2018

Inspections of schools previously judged to be good
In September 2015, we introduced short inspections for schools that were judged good at their most recent full inspection. Short inspections last for 1 day and take place approximately every 4 years. A short inspection determines whether the school continues to provide a good standard of education for pupils and whether safeguarding is effective. Following 2 consultations in 2017,[footnote 23] in the 2017/18 academic year, we introduced 2 further changes to the way we inspect good schools.
In November 2017, we began using risk assessment to select some good schools for full inspections instead of short inspections. When a risk assessment suggests that it would be highly likely for a short inspection to convert to a full one to gather more evidence, we arrange that full inspection from the start. This happens in approximately 1 in 5 inspections of good primary and secondary schools due for inspection in the year.
In January 2018, we made a change that reduced the proportion of short inspections that convert immediately. If a school was previously good, an inspection will now only convert if the lead inspector has serious concerns about safeguarding, behaviour or the quality of education to the extent that the school may be judged inadequate at a full inspection.
In 76% of cases, the short inspection confirms that the school remains good and we schedule a further section 8 inspection for approximately 4 years’ time. When inspectors believe that the school may have improved to outstanding or declined from good if it had been a full inspection, we schedule a full inspection for 1 to 2 years’ time.[footnote 24] Before January 2018, these short inspections would have converted immediately.
These changes in policy have led to a substantial decrease in the proportion of short inspections that convert to a full inspection. Since January 2018, less than 1% of short inspections of good schools have converted to a full inspection. This is down from 22% between September and December 2017 (before the change came in in January 2018) and 29% in 2016/17. This is in line with the intentions explained in the consultation.
Overall, across all types of schools, we inspected over 4,800 previously good schools this year, either through a full or a short inspection. Eighty-three per cent maintained their good grade, 2% improved to outstanding and 15% declined to requires improvement or inadequate. The changes to the way we inspect these schools mean that it is not possible to accurately compare the outcomes this year with those from previous years.
Inspections of schools previously judged to be outstanding
There are currently 4,500 schools judged outstanding at their most recent inspection, including 3,800 primary and secondary schools. As part of the 2011 Education Act, the government made outstanding primary and secondary schools exempt from routine inspections. This means that we have been unable to carry out regular inspections of these schools. As a result, 17% of outstanding schools have not had a full inspection in the last 10 academic years.
However, we are still able to inspect exempt outstanding schools if their performance gives cause for concern, and have inspected 48% of these schools within the last 6 academic years. We have inspected 149 of these schools this year. Of those schools that had their inspection converted to a full inspection, only 7 kept their outstanding grade, 55 declined to good, 35 declined to requires improvement and 10 declined to inadequate. The remaining 42 schools did not have a full inspection and remained outstanding.
Overall, 67% of the exempt schools visited this year declined from their previously outstanding grade. However, this is not surprising because most of the exempt schools inspected were those whose performance appeared to be declining.

Complaints made to Ofsted about schools
In 2017–18,[footnote 25] Ofsted received around 11,700 complaints about schools. Ofsted has powers to investigate ‘qualifying’ complaints. A qualifying complaint is one that raises serious whole-school issues. We only consider these complaints to determine whether to inspect a school earlier than scheduled. When a complaint does not qualify for investigation by Ofsted (for example, when formal local complaint routes have not been completed), we give complainants information about appropriate sources of help and advice. This includes details of other relevant statutory agencies (if their powers would ensure a better outcome for the pupils).
The complaints this year included safeguarding concerns such as knife-related incidents, attempted/actual suicides, self-harming and allegations of sexual abuse. All safeguarding cases are passed to the appropriate statutory agency for investigation. Of the 1,930 qualifying complaints, the large majority concerned the leadership and management of a school, pupils’ well-being, or both.
In 1,410 complaints, the information from the complaint was retained until the next scheduled school inspection so that the issues raised could be taken into account. On almost 140 occasions, the outcome decision when the complaint was closed was to carry out an immediate inspection of a school.
Stuck schools
The overall quality of schools has improved over the last few years (see Figure 10). However, we judged 11% of schools to require improvement at their latest inspection and 4% to be inadequate. This is over 3,100 schools.
In last year’s Annual Report, we highlighted a group of around 120 schools that required improvement, had not improved at their inspection in 2016/17 and had performed poorly for a very long time.[footnote 26]
This year, we have looked in more detail at the characteristics of schools that we have judged as requires improvement, satisfactory or inadequate at every inspection since 2005.[footnote 27] This is a much wider group of schools because it is not limited to those most recently inspected in the last academic year. Some schools had become academies during this period, so we have included the inspection outcomes of both their predecessor LA-maintained school and, where available, of the new academy.
There are around 490 of these ‘stuck’ schools, including: around 290 primary schools and 190 secondary schools. The remaining 10 are pupil referral units and special schools. This means that around 1 in 6 of the schools that currently require improvement or are inadequate have been stuck in a cycle of weak inspection outcomes since 2005.
Our analysis of these ‘stuck’ primary and secondary schools found that:
- 2% of primary and 5% of secondary schools have been stuck at satisfactory/requires improvement/inadequate since 2005[footnote 28]
- 8 out of 10 stuck schools have moved back and forth between satisfactory/requires improvement/inadequate
- the proportion of pupils who are eligible for free school meals and that for those who are White British and eligible for free school meals are well above the national average
- 4 out of 10 schools had a review of how they use their pupil premium funding recommended in at least one of their inspections in the last 3 years[footnote 29]
- in 2017, pupils in stuck schools made poor progress by the end of key stages 2 and 4
- the proportion of stuck secondary schools varies considerably between different regions (between 2% and 10% in each region)
- stuck schools are more likely to have become academies and to be in multi-academy trusts, which is a reflection of the government’s policy to place struggling schools in multi-academy trusts (MATs)[footnote 30]
Table 1: Characteristics and performance of pupils in stuck schools and in all schools nationally[footnote 31]

In each region, between 1% and 3% of primary schools and between 2% and 10% of secondary schools are stuck. Secondary schools in the north and Midlands are generally more likely to be stuck than those in the south and east.
Table 2: Proportion of all secondary schools that are stuck, by region

We have inspected the vast majority of stuck schools between 4 and 6 times since September 2005. A handful have been inspected 7 or 8 times. Many have become academies at some stage. Of these, some have been inspected both as the original school maintained by the LA and more recently as the academy.[footnote 32]
Figure 11: Example of the inspection history of a stuck secondary school

Next year, we will start an evaluation project to understand why some interventions to help schools improve, including inspection, are consistently ineffective for some schools. We will consider the long-term trajectories of stuck schools when we consider schools for inspection. We may also discuss individual cases with the relevant LAs and MATs.

Academies and multi-academy trusts
The academy sector continues to grow and evolve. In August 2018, there were nearly 7,900 academies and free schools. This is an increase from 6,900 academies at the same time last year. More than two-thirds of these new academies were LA schools that chose to become converter academies.
One of the factors contributing to the increase in the number of academies is the legal changes that the government introduced in 2016.[footnote 33] These changes mean that any school maintained by an LA and judged to be inadequate is required to become an academy.
Directive academy orders for inadequate schools
Since April 2016, the DfE has issued nearly 500 directive academy orders (DAOs) to LA schools that Ofsted had judged to be inadequate. At the end of August 2018, there were 220 schools under DAOs.
Figure 12: Open schools with directive academy orders, by length of time since the order was issued, 31 August 2018

Based on the 240 schools that have closed following a DAO so far, on average, a school closes 10 months after the DAO was issued. These delays can be due to an appropriate sponsor not being available or due to legal and financial issues, such as debt, land or private finance initiative contracts.
We changed our policy on monitoring schools under a DAO to reflect these extended timescales. In discussion with the DfE, we moved from only monitoring those schools with ineffective safeguarding to reviewing on a case-by-case basis whether the school may need an inspection. We work with the regional schools commissioners to track when schools are likely to close. We may visit the school if it is likely to remain open for a prolonged period of time. When we inspect these schools, they sometimes improve their inspection grade. The Secretary of State may then decide to ‘revoke’ the original academy order.
The growth of multi-academy trusts
The number of MATs[footnote 34] has also increased this year. There were almost 800 MATs in August 2016, just under 1,000 in August 2017 and over 1,100 in August 2018. Collectively, these MATs oversee the education of over 2.5 million pupils. The rate at which new MATs are opening has slowed down this year, but at the same time around a third of existing MATs have grown in size.
The vast majority of new academies now join a MAT from the outset (98% in 2017/18). Almost all sponsor-led academies are in a MAT, as are 7 out of 10 converter academies, 6 out of 10 free schools and nearly 9 out of 10 studio schools. University technical colleges are still more likely to be in a standalone trust and only 3 out of 10 are part of a MAT.
Most MATs are small groups of schools, working together on a local basis. More than two-thirds operate within a single LA area. The average size of a MAT is 5 schools, although just under half have 3 schools or fewer. Around 160 large MATs have 9 schools or more, including 35 that have 20 or more.
Thirty-four per cent of MATs have taken on at least one additional school this year, 61% have remained the same size and 5% have contracted or closed. Overall, MATs now run just over 1,170 more academies than in August 2017.
Academy transfers
Academies transfer between trusts for a number of reasons, including voluntarily, as a result of an intervention due to concerns (known as re-brokerage) or following the closure of a trust. Since 2011, over 700 academies have moved between trusts.
Although the number of academies transferring is increasing, it is still the case that only a very small proportion of academies move each year. In 2017/18, 260 academies transferred from one trust to another. This represents 3% of open academies.
Of the academies that transferred and joined a MAT this year, 49% did so for the first time and 51% transferred from one MAT to another. The move can be initiated by the academy rather than the regional schools commissioner. Two-thirds of the academies that transferred this year were judged to be good or outstanding at their last inspection prior to the transfer.
Of all the academies that have moved trusts since 2011, around 200 have been inspected both before and since the transfer. Fifty-two per cent of the 150 schools that were less than good before the transfer improved to good or outstanding at their most recent inspection.
Summary evaluations of multi-academy trusts
The MAT sector is large, growing and still evolving. We have carried out evaluations of MATs since 2013, making 23 reviews of 21 different MATs so far.[footnote 35] In 2017/18, we evaluated 5 MATs: David Ross Education Trust, Diocese of Ely Multi-Academy Trust, Diocese of Leicester Academies Trust, Romero Catholic Multi Academy Company and Diocese of Norwich Education and Academies Trust.
These evaluations involve inspecting a selection of the academies in the MAT that were due to be inspected in that academic year, seeking the views of leaders in other academies in the MAT that are not being inspected, and meeting with trustees and senior leaders of the MAT.
Off-rolling
This year, we have investigated potential ‘off-rolling’. We wanted to better understand the schools and pupils that are affected, identify schools in which this may be an issue and take action to tackle this problem.
There is no official definition of off-rolling. However, we use the following definition to assist inspectors in their conversations with schools.[footnote 36]
Off-rolling is the practice of removing a pupil from the school roll without a formal, permanent exclusion or by encouraging a parent to remove their child from the school roll, when the removal is primarily in the interests of the school rather than in the best interests of the pupil. Off-rolling in these circumstances is a form of ‘gaming’. There are many reasons why a school might remove a pupil from the school roll, such as when a pupil moves house or a parent decides (without coercion from the school) to home-educate their child. This is not off-rolling. If a school removes a pupil from the roll due to a formal permanent exclusion and follows the proper processes, this is not off-rolling.
Formal exclusions and off-rolling are not the same thing. However, they are related because both can be about problems in managing poor behaviour and both are included in the overall numbers of pupils moving schools each year.
Analysis of pupil movements
Around 19,000 pupils did not progress from Year 10 to Year 11 in the same state-funded secondary school, based on our analysis of pupil-level data from the DfE’s school census.[footnote 37] This is 4% of all Year 10 pupils. It can be very disruptive for the pupils and families involved, particularly at such an important time in the pupils’ education.
Of the 19,000 pupils:
- the destination of 9,700 pupils is unclear, because they do not reappear in another state-funded school
- 25% of pupils move to other secondary schools and 20% move to alternative provision in the state-funded sector
- 30% of pupils who move have SEND compared with 13% of all pupils
- 54% of pupils who move are eligible for free school meals compared with 28% of all pupils[footnote 38]
We recognise that some pupils who did not reappear in the census of a different state-funded school may have moved to an independent school (including special schools and alternative provision) or may have become home-educated. However, some may have ended up in an unregistered school or dropped out of education entirely. Unfortunately, it is not possible to know the full story of where pupils went to, and why, from the data alone.
Identifying exceptional levels of pupil movements
We have developed a statistical model to estimate the proportion of pupils we might expect to leave each school between Years 10 and 11. This takes into account the characteristics of the pupils, such as eligibility for free school meals, the proportion of pupils with SEND, gender and pupils’ attainment at key stage 2.
The model helps to show where ‘exceptional’ levels of pupils have moved and where this has been a consistent pattern in each of the last 2 years. Out of 2,900 schools that lost some pupils between Years 10 and 11, the model highlighted around 300 schools that had particularly high levels of movements. These may be an indication of off-rolling or might be attributed to ordinary factors such as several family moves. We use this model to inform our discussions with LAs and MATs, to prioritise our inspections and to ask questions in school inspections.
Provision for children with SEND
In January 2018 there were 1.3 million pupils with SEND, which represents 15% of all pupils. Of these, 250,000 pupils had a statement of SEN or an education, health and care (EHC) plan and around 1 million pupils were on SEN support.[footnote 39] Both groups have increased in number since January 2017.[footnote 40], [footnote 41] Ninety-three per cent of pupils with SEN support are educated at state-funded mainstream schools, whereas 46% of pupils with a statement or an EHC plan attend a special school.[footnote 42]
There are around 1,000 state-funded special schools and 480 independent special schools. We inspect all of the state-funded special schools and 470 of the independent special schools which are not part of an association.[footnote 43] Although the independent schools are fee-paying schools, some of the places in them are funded by LAs for children from their area.
In addition, some mainstream schools have specialist units, although the number of schools offering this support has decreased since 2017. In SEN units, pupils spend the majority of their time in the unit and only attend mainstream classes for a few lessons. There are now 1,392 SEN units compared with 1,524 in 2017. In specialist resourced provision (SRP), pupils spend most of their time in mainstream classes, but attend the SRP for individual support, to learn a specific skill, to receive medical or therapeutic support or to access specialist equipment. There are now 1,765 SRPs compared with 1,965 in 2017.[footnote 44]
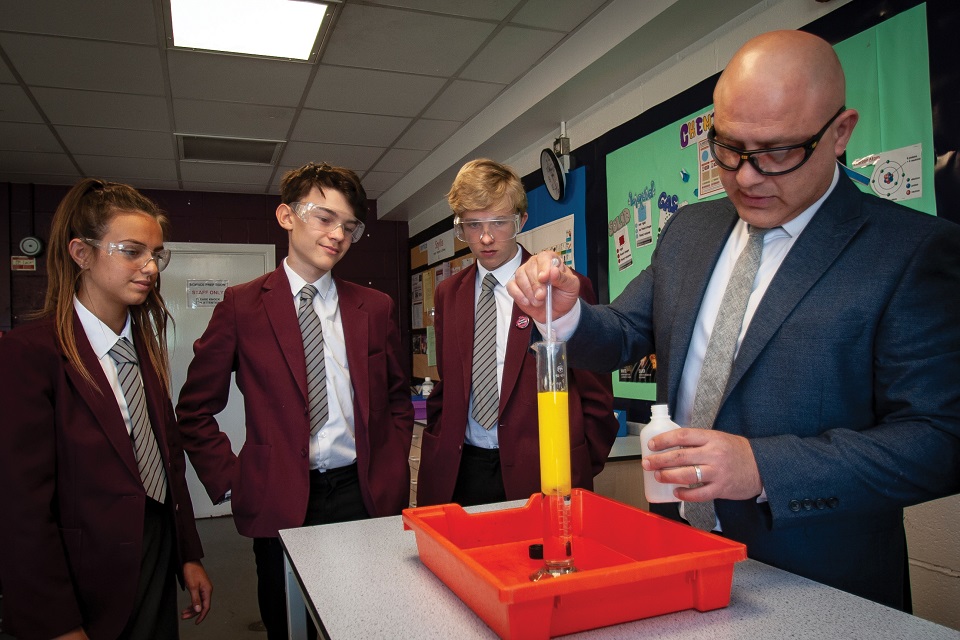
Inspection outcomes
State-funded special schools have better inspection outcomes than non-association independent special schools (92% compared with 78% good or outstanding). State-funded special schools are far more likely to be outstanding (38% compared with 18%) and less likely to be inadequate (3% compared with 7%). Both groups have the same proportion of good and outstanding schools as at the end of August 2017.
Preparing young people for adulthood
Outcomes for young people with SEND are often poor by age 16. In 2016/17, the Progress 8 score for pupils with SEN support was -0.43 and for those with a statement or EHC it was -1.04.[footnote 45] In June 2017, 87% of 16- to 17-year-olds with SEND were in education or training compared with 92% without SEND.[footnote 46]
Special schools can play a vital role in preparing young people with SEND for adulthood. An analysis of inspection reports of state-funded special schools inspected and judged outstanding in 2017/18 showed that this was a strength in the vast majority of these schools. The inspection reports highlighted the following:
- Senior leaders are ambitious for pupils and expect them to be as well prepared as they can be for the next stage of their lives.
- Learning programmes are tailored to the individual needs, interests and aspirations of pupils.
- Pupils work towards academic and vocational qualifications which are relevant to their further education and career aspirations.
- There is a continued emphasis on developing pupils’ English, mathematics and communication skills.
- Pupils and their parents receive clear and helpful information and guidance, helping them to make informed decisions.
- The curriculum includes carefully planned opportunities for pupils to develop work-related knowledge and skills, such as high-quality work placements, internships and apprenticeships.
- Transitions to further education, training or employment are carefully structured and supported.
Problems accessing the right education and support
The level of demand for local authorities to undertake EHC needs assessments has increased by over 50% since 2015. In 2017, 45,200 children and young people were assessed and a decision taken to whether they need an EHC plan. The number of requests for EHC plans that are either refused or delayed is also increasing. LAs can refuse to carry out an EHC needs assessment if they believe it has not met the required threshold of needs. In 2017, there were around 14,600 refusals to carry out an assessment. This is a third more than in 2015.[footnote 47] Once a child has been assessed, they may still struggle to access the services they need. In 2018, 2,060 children with a statement or EHC plan were awaiting provision, which is almost 3 times more than in 2010.[footnote 48]
Pupils with SEND who are in mainstream secondary schools can also struggle to access good-quality education. They are more likely to have a fixed-term exclusion, a permanent exclusion or to be off-rolled (see section on off-rolling). We are concerned that in secondary schools:
- pupils with SEN support are 5 times more likely to have a permanent exclusion than pupils with no SEND
- 27% of pupils with SEN support had a fixed-term exclusion last year – 93,800 pupils[footnote 49]
- nearly 5,800 pupils with SEND left their school between Years 10 and 11 and some of them may have been ‘off-rolled’; pupils with SEND account for 13% of all pupils but 30% of those who leave their school
- it is not clear where these Year 10 pupils move on to; half do not reappear in another state-funded school, more than a quarter go to state-funded alternative provision/pupil referral units, but only a small proportion move to a state-funded special school
Local area SEND inspections
The Children and Families Act 2014 places responsibility on the local area, which includes the local authority, health commissioners and providers, to identify and meet the needs of children and young people with SEND aged 0 to 25. Ofsted and the Care Quality Commission (CQC) inspect how well local areas fulfil these new duties. The inspections are known as local area SEND inspections and began in May 2016. We will inspect all local areas over a 5-year period.
By the end of July 2018, Ofsted and the CQC had inspected 68 out of 152 local areas. Of these, 30 areas were required to provide a ‘written statement of action’ (WSoA), an indication of serious failings.[footnote 50], [footnote 51]
Figure 13: Outcomes of local area SEND inspections, 31 August 2018 (numbers)

Pupil referral units and alternative provision
Alternative provision is a diverse and complex sector, some of which is not regulated. It includes:
- education arranged by LAs for pupils who, because of exclusion, illness or other reasons, would not otherwise receive suitable education
- education arranged by schools for pupils on a fixed-period exclusion
- schools sending pupils to off-site provision to improve their behaviour[footnote 52]
Alternative provision may be provided by:
- pupil referral units (PRUs) maintained by LAs
- alternative provision academies and free schools
- registered independent schools
- unregistered independent schools
- charities and other organisations
We inspect alternative provision and PRUs that offer full-time education and are registered with the DfE as either state-funded or non-association independent schools.[footnote 53] However, not all providers are required to register with the DfE. Schools must register if they provide full-time education[footnote 54] for 5 or more pupils of compulsory school age, one or more pupils of compulsory school age with an EHC plan, or one or more pupils of compulsory school age who are looked after by the LA. Some providers do not need to register. Others may need to register but may not be aware or may have chosen not to.
We inspect around 350 state-funded PRUs and alternative provision academies and free schools. Two-thirds of these are pupil referral units run by LAs and a third are academies,[footnote 55] including 40 free schools. Almost three-quarters of the academies and free schools are part of a MAT.
Together, these 350 state-funded schools educate over 16,700 children and young people. Forty per cent of these pupils are eligible for and claiming free school meals. Eighty-eight per cent of the pupils are aged between 11 and 15.[footnote 56]
Independent schools register with the DfE but there is no specific category for alternative provision (schools are classified as either ‘special schools’ or ‘other’). Research by FFT Education Datalab and The Difference estimated that, in 2017, there were 128 registered independent establishments offering alternative provision.
Inspection outcomes for state-funded pupil referral units and alternative provision academies and free schools
Eighty-two per cent of all state-funded PRUs and alternative provision academies and free schools were judged to be good or outstanding at their most recent inspection. This is a small reduction from 84% in August 2017.[footnote 57]
Inspections of unregistered provision
Schools that are required to be registered but have not done so are operating illegally. Ofsted’s unregistered schools taskforce visits these settings and has found examples of when they are badly maintained, unsafe or even squalid. We have no powers to assess the quality of their education, but we know from our inspectors’ experience that the quality of their education and pastoral support is often not of the level that the children attending them have the right to expect. Where we find providers operating an unregistered school, we inform the DfE and issue a warning notice to the provider requiring them to cease operating illegally.
Since January 2016, our unregistered schools taskforce has received referrals of around 160 suspected cases of unregistered alternative providers. It has inspected around 110 settings for which our initial investigations suggested that there was reasonable cause to believe an unregistered school was operating.
Initial teacher education
There are around 260 initial teacher education (ITE) partnerships. Around 170 are school-led partnerships, 10 are Teach First and around 80 are university-led. They offer training for one or more age-phase partnerships: early years, primary, secondary or further education. Over the last few years, the number of school-led partnerships has grown. Some are now part of MATs.
When we inspect an ITE provider, we usually make separate judgements for each age-phase partnership. A small number of providers receive a single set of judgements for primary and secondary phases combined. We inspect ITE providers in 2 stages:
- Stage 1 is in the summer term and allows inspectors to observe trainees during their training.
- Stage 2 is in the following autumn. This focuses on observing newly qualified teachers or former trainees in the classroom. Outcomes of inspections are only finalised after the second stage.
The current inspection framework for ITE has been extended for an additional year. Over the next year, we will be doing research and talking to ITE partnerships to develop the next ITE framework. We will launch the next framework in early 2020 after the education inspection framework begins in September 2019.
Inspection outcomes
At the end of June 2018, we had judged 99% of age-phase partnerships to be good or outstanding at their most recent inspection. This is the same proportion as at the end of June 2016 and June 2017. However, the proportion of outstanding age-phase partnerships has increased by 2 percentage points to 36% since the end of June 2017. The proportion of good age-phase partnerships has decreased by 2 percentage points to 64%.
With just one outstanding partnership out of 19, early years has the lowest proportion of outstanding age-phase partnerships. Primary and primary/secondary partnerships have the highest proportion: just under half are outstanding.[footnote 58]
The inspection outcomes are very positive for all types of partnerships. Ninety nine per cent of both school-centred initial teacher training (SCITT) age-phase partnerships and higher education institution (HEI) partnerships are good or outstanding. We have inspected 12 of the 13 Teach First age-phase partnerships. Ten were judged to be outstanding and 2 judged to be good. A larger proportion of SCITT than HEI age-phase partnerships are outstanding (43% and 27%, respectively). HEI partnerships are much larger institutions, teaching far more trainees, and usually offering multiple phases (for instance early years ITT and further education).
Figure 14: Most recent overall effectiveness of ITE age-phase partnerships as at 30 June 2018, by type of partnership (numbers)

One hundred SCITT partnerships are part of a MAT. Of these, 65 have been inspected, covering 68 age-phase partnerships. Of these 68 partnerships, we judged 31 to be outstanding, 36 to be good and one to require improvement. So far, the outcomes for inspections of SCITT partnerships in MATs are fairly similar to those not in MATs. We will be able to see a fuller picture of the quality of SCITT partnerships in MATs after we have inspected the remaining partnerships.
Less than good ITE provision
Since September 2012, we have judged 30 ITE age-phase partnerships to be less than good. Two were inadequate and 28 required improvement. Sixteen of these age-phase partnerships improved to good at their next inspection, and one improved to good at their following inspection. Two partnerships did not improve after their next inspection and subsequently closed. The remaining 11 closed before their next inspection.
When “provision is repeatedly of requires improvement or lower quality”,[footnote 59] the DfE will often withdraw trainee allocations until we judge the provision to be good or outstanding. As a result, some partnerships close all or part of their provision when judged to be less than good. This policy is also one of the reasons why inspection outcomes for all open partnerships are so high. Weaker age-phase partnerships often close, so are then not included in the outcomes for all open partnerships at their most recent inspection.
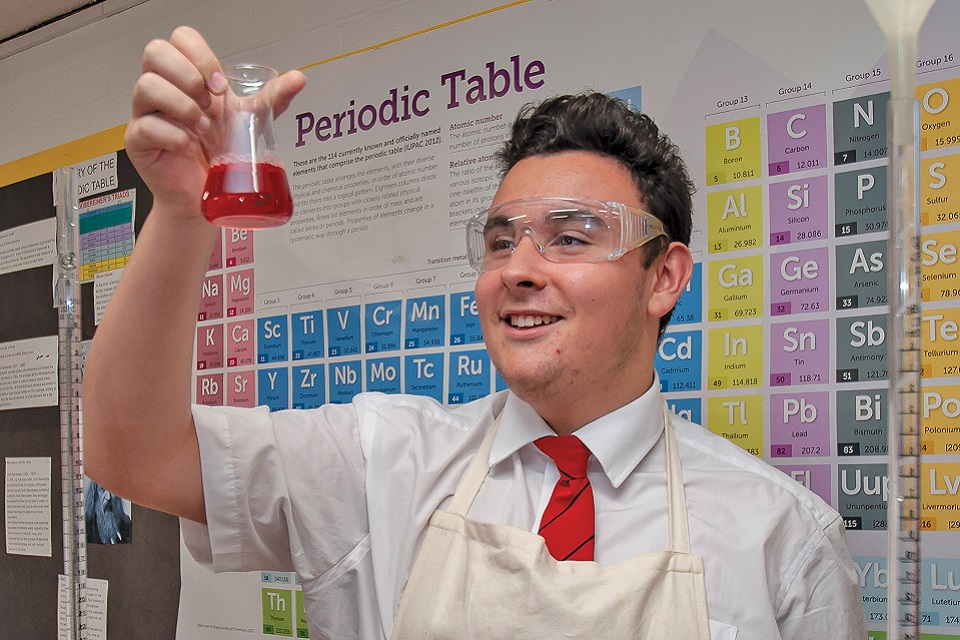
Independent schools
In this section:
There are over 2,320 independent schools in England. Of these, we inspect around 1,080 non-association independent schools, which fall into 2 categories: independent special schools; and other independent schools. Over two fifths of the independent schools that we inspect are special schools.
Schools that are members of associations are inspected by other inspectorates.[footnote 60] The Independent Schools Inspectorate inspects most of these.
Section overview
Inspection outcomes for non-association independent schools have remained broadly the same since last year. Sixty-nine per cent of schools are judged good or outstanding at their most recent inspection as at 31 August 2018.
Safeguarding has improved but the proportion of schools with ineffective safeguarding arrangements remains high, at 10%.
Non-faith schools have better outcomes than faith schools. Just over half of faith schools are judged good or outstanding compared with three quarters of non-faith schools.
There is still a high proportion of inadequate schools. While about half of inadequate schools have improved to good, about a fifth have been inadequate since the common inspection framework (CIF) was introduced in September 2015. A further 88 schools have declined to inadequate over the period.
Figure 15: Number of non-association independent schools as at 31 August 2018, and number of inspections carried out in 2017/18

Inspection outcomes
In 2017/18, we carried out just over 550 standard inspections of non-association independent schools. Thirteen per cent of schools were judged outstanding, 54% good, 22% requires improvement and 12% inadequate. [footnote 61]
By 31 August 2018, around 1,010 (94%) schools had received a standard inspection. The remaining 6% are new schools or those that moved inspectorate and had yet to receive their first inspection.
The proportion of good or outstanding schools has decreased since the introduction of the CIF in September 2015. On 31 August 2018, 69% of schools were good or outstanding compared with 75% on 31 August 2015.
Figure 16: Overall effectiveness of non-association independent schools at their most recent inspection, since 31 August 2013

We inspect around 470 independent special schools. The proportion judged good or outstanding (78%) has remained stable since 31 August 2017. This compares with 92% of state-funded special schools (discussed previously).
A higher proportion of independent special schools were judged outstanding compared with other independent schools: 18% and 11%, respectively.
Figure 17: Overall effectiveness of non-association independent schools at their most recent inspection, 31 August 2018

Safeguarding
A separate safeguarding judgement was introduced with the CIF in September 2015. Since then, around 980 non-association independent schools have been assessed for safeguarding at their most recent standard inspection. Although the proportion of schools receiving ineffective safeguarding judgements fell by 5 percentage points since last year, it remains high, at 10% by 31 August 2018.
It is important to recognise that because of the way schools are selected for inspection, in any one year, the sample of schools inspected is not necessarily representative of all independent schools. This might in part explain the rise in the proportion of schools with effective safeguarding within the year.
Independent special schools are more likely to be effective at safeguarding than other independent schools (94% compared with 87%). All schools (97) that had ineffective safeguarding were inadequate in their overall effectiveness.
Non-association independent faith schools
Inspection outcomes for faith schools[footnote 62] remain substantially weaker than non-faith schools. Three quarters of non-faith schools were judged good or outstanding compared with just over half of faith schools. Nearly a quarter of all faith schools were judged inadequate at their most recent standard inspection.
Figure 18: Overall effectiveness of non-association independent schools at their most recent inspection, by faith, 31 August 2018

There is variation across the different faith groups. Less than 50% of Jewish schools were judged good or outstanding at their most recent inspection compared with 63% of Christian schools and 52% of Muslim schools.
Inspections since the start of the common inspection framework
Since the launch of the CIF, we have carried out around 1,160 standard inspections of non-association independent schools. Of these inspections, 62% resulted in an overall effectiveness judgement of good or outstanding. [footnote 63]
Inspection outcomes have declined compared with around 870 inspections carried out in the 3 years before the CIF. Of these, 69% resulted in an overall effectiveness grade of good or outstanding.

Figure 19: Overall effectiveness of non-association independent school inspections before and after the introduction of the common inspection framework

Inadequate schools
Seventy schools were inadequate before we introduced the CIF. Of the 53 schools that remained open on 31 August 2018, 24 improved to good and 13 were judged as requires improvement at their most recent inspection. Twelve schools retained their inadequate rating.[footnote 64] Two of these have improved to meet the standards checked at their latest progress monitoring inspection but have not yet had another full inspection. Some of the 12 have improved to meet the standards only to fall back into failure again. The most common failing was the effectiveness of leadership and management.
Despite some schools improving, the number of inadequate schools remains high. Around 10% of schools that received their first inspection in 2017/18 were judged inadequate. Furthermore, a similar proportion of schools that were previously good or outstanding have declined to inadequate this year.
Compliance with Independent School Standards (ISS)
As well as being judged on their overall effectiveness at inspection, non-association independent schools are also judged on their compliance with the 8 parts of the Independent School Standards. Based on their most recent inspection, 77% of schools met all the standards.[footnote 65] No inadequate schools met all the standards.
Schools are most likely not to meet the standards in the quality of leadership and management: just over a fifth of schools inspected in 2017/18 did not meet this standard. Of the 65 schools judged inadequate this year, all failed to meet standards for leadership and management.
Table 3: Compliance with the Independent School Standards, outcomes for standard inspections, 1 September 2017 to 31 August 2018

We also carry out progress monitoring inspections of schools that did not meet all standards at their last inspection. The progress made towards these standards has been poor in 2017/18. We carried out around 120 progress monitoring inspections this year, in which only 52 schools improved.
Schools operating within their registration agreement
From September 2017, our inspectors began recording information about whether a school is complying with its registration agreement. There are 7 changes that lead to a school being judged to be working outside its registration agreement. These are:
- change of proprietor
- change of school premises
- change to the age range of pupils
- change to the maximum number of pupils
- the school has proposed a change from single-sex to co-educational or vice-versa, or a change in admitting boys instead of girls, or girls instead of boys
- the school intends to provide boarding accommodation or cease to provide it
- the school intends to admit pupils with SEN or cease to admit them
Since 1 September 2017, we have recorded registration compliance information for just under 460 non-association independent schools. We found 38 schools that did not comply with the registration agreement at their most recent standard inspection. The most common reasons for schools not complying with their registration agreements were a change in the maximum number of pupils (16 schools) or a change in the age range of the pupils they provide for (20 schools).[footnote 66] In one instance, a school had more than twice as many pupils as the registered maximum. The school also had children on roll who were outside of the registered age range. When we find a school that does not comply with its registration agreement, we report it to the Department for Education.
Unregistered schools
An unregistered school is defined as a setting that is operating as an independent school without registration. A setting must register as an independent school if it is not maintained by the LA or is not a non-maintained special school and provides full-time education for:
- 5 or more pupils of compulsory school age
- one or more pupils of compulsory school age with an education, health and care (EHC) plan or SEN, or who are looked after by an LA
It is against the law to operate an unregistered independent school in England. Children attending them are at risk because there is no formal external oversight of safeguarding, health and safety or the quality of education provided.
In January 2016, we set up an unregistered schools taskforce to investigate settings that are operating as illegal unregistered schools. We have received referrals of around 480 suspected cases.[footnote 67] We receive referrals from a range of different sources:
- members of the public
- the Department for Education
- local authorities
- inspectors
- other sources
Our inspectors investigate every referral they receive. So far, they have inspected around 240 settings after their initial investigations suggested that there was reasonable cause to believe an unregistered school was operating.
Inspectors have identified some common types of settings. They record at least one type for each setting but it is possible for some settings to have more than one type.
Table 4: Number of different types of setting identified, 1 January 2016 to 31 August 2018

We have investigated settings in every Ofsted region. We identified the highest numbers of potential unregistered schools in London and the West Midlands.
Figure 20: Number of referrals and warning notices, by Ofsted region, 1 January 2016 to 31 August 2018

Inspectors issue a warning notice when they find sufficient evidence to suggest that an institution may be operating as an illegal school. This instructs those responsible for the illegal school to stop operating without delay. Since January 2016, we have issued warning notices to 63 settings.
Some settings, including some alternative providers, were not always aware that they met the definition of an unregistered school. After they have received a warning notice, these settings have either registered promptly, changed their service or closed. However, other providers have intentionally operated outside of the law.
Figure 21: Number of unregistered settings with warning notices issued, by outcome, 1 January 2016 to 31 August 2018

Some settings are operating, often deliberately, in a way that means they do not quite meet the requirements to register. They may be offering between 16 to 18 hours of education or more than 18 hours of a very limited curriculum. Inspectors call these ‘borderline settings’ and monitor them closely.
Investigations may lead to prosecutions. In October 2018, 2 people were found guilty of running an illegal school, Al-Istiqamah Learning Centre, in Ealing, London. This is the first successful prosecution for the unregistered schools taskforce.
We also work closely with other agencies, including LAs and the fire service, to share information and ensure that when they have powers to intervene and protect children at risk, they use them. We have identified safeguarding or health and safety issues in 35% of the settings we have inspected.
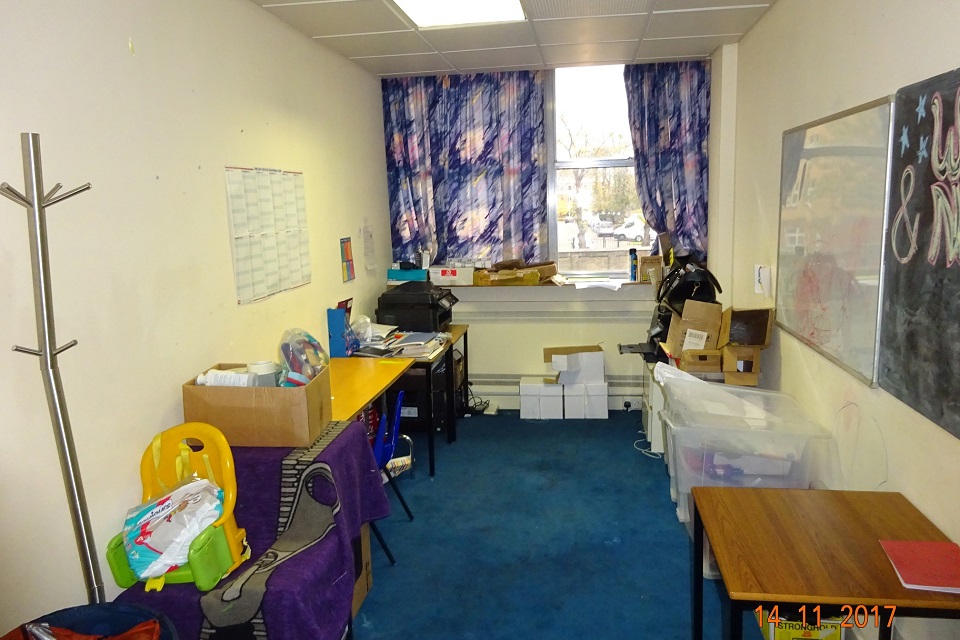

Further education and skills
In this section:
- Section overview
- Independent learning providers
- The quality of apprenticeships
- The quality and management of subcontractors
- General further education colleges
- Community learning and skills providers
- Sixth-form colleges and 16 to 19 academies
- Independent specialist colleges and high needs provision
- Education, skills and work in prisons and young offender institutions
The further education and skills sector is mainly made up of independent learning providers, colleges and community learning and skills providers. The sector provides education, training and apprenticeships to around 3.2 million learners aged 16 and over.[footnote 68]
Section overview
The apprenticeship funding reforms introduced in April 2017 have changed the further education (FE) and skills landscape significantly. The number of providers subject to inspection has increased by more than two fifths since 31 August 2017. On 31 August 2018, there were nearly 1,700 FE and skills providers subject to inspection. Many of the additional providers will not have been inspected in the past. Consequently, we have introduced new provider monitoring visits. Most of the providers visited in 2017/18 were making at least reasonable progress in setting up their apprenticeship programmes.
College mergers and sixth form colleges converting to become academies (known as ‘academisation’) continue to change the college landscape. Mergers have created fewer, but much larger, colleges. The number of these colleges that now have over 10,000 learners has doubled since September 2015. A quarter of sixth form colleges have merged or academised this year.
There has been a marked increase in the proportion of general FE colleges judged good or outstanding at inspection this year. The proportion of good or outstanding independent learning providers (including employer providers) has declined to below 80%.
During 2017/18, we inspected 329 providers and carried out 88 monitoring visits. We also contributed to 41 prison and young offender institution inspections.[footnote 69], [footnote 70]
Figure 22: Number of further education and skills providers as at 31 August 2018 and number of inspections carried out in 2017/18

Inspection outcomes
From the 329 full and short inspections this year, 4% of the providers were judged outstanding, 66% good, 24% requires improvement and 6% inadequate.
Each year, the number of providers subject to an inspection will change as contracts to provide education, training and apprenticeships are won and lost. Historically, at any given point in the year, we will have inspected the quality of education and training in around 90% of the providers. The remaining providers falling within our commitment to inspect new providers within their first 3 years of operation. However, due to the increase in new providers gaining funding contracts, largely as a result of the apprenticeship reform programme, the proportion of providers with an overall effectiveness grade dropped to 62% by 31 August 2018.
We have inspected just over 1,000 providers, of which 8 out of 10 were judged to be good or outstanding at their most recent inspection. This is a similar proportion to last year.
Figure 23: Overall effectiveness of further education and skills providers at their most recent inspection, 31 August 2018

The proportion of general FE colleges judged good or outstanding at their most recent inspection increased by 9 percentage points. The proportion of good or outstanding community learning and skills providers increased by 5 percentage points. These increases are balanced out by the continued decline in independent learning providers (including employer providers). The overall proportion of providers judged good or outstanding has increased by just one percentage point.
Figure 24: Proportion of providers judged good or outstanding for overall effectiveness at their most recent inspection, by provider type and over time

Independent learning providers
The number of independent learning providers (ILPs) and employer providers has more than doubled, from just over 490 providers on 31 August 2017 to nearly 990 on 31 August 2018.
This increase is due largely to the introduction of the apprenticeship levy in May 2017. The levy is paid by employers that have an annual employee pay bill in excess of £3 million – less than 2% of UK employers. It is designed to fund new apprenticeships being delivered through a standard or a continuing framework if the standard has not yet been developed. Only providers that have been approved and included on the Register of Apprenticeship Training Providers (RoATP) can draw down funds from the levy. We do not inspect providers on the RoATP until they have entered into a contract with an employer and started to deliver apprenticeships on the employer’s behalf.
New providers receive a full inspection within their first 3 years of operation. Within any given year, this means that the proportion of the ILPs (including employer providers) waiting for their first full inspection is usually less than 20%. This year, however, that figure rose to 55% because of the large increase in the number of providers.
Figure 25: Number and proportion of independent learning providers (including employer providers) inspected, over time

Last year, 80 ILPs (including employer providers) were delivering the majority of their training through Advanced Learner Loans. Only 53 of these providers drew down on this funding and delivered training within 2016/17. The number of providers has declined to 43 this year. Reasons for the decline include:
- several providers beginning to deliver apprenticeships and acquiring funding through that route
- some providers ceasing to deliver training or going into administration
- the Education & Skills Funding Agency taking the loans facility from some providers, in some cases when we have judged the provider to be inadequate
Inspection outcomes
We inspected 115 independent learning providers (including employer providers) this year. On 31 August 2018, we had judged 78% of ILPs (including employer providers) to be good or outstanding at their most recent inspection. This is a 3 percentage point decrease from the previous year. Forty-two were judged requires improvement or inadequate. This included 16 providers that declined from outstanding or good to requires improvement or inadequate and 27 providers being inspected for the first time. We judged nearly two thirds of the ILPs (including employer providers) being inspected for the first time as requires improvement or inadequate, across nearly all of the 5 main inspection judgements and for their adult learning programmes. This was a similar proportion to last year.
In the 16 providers that declined from outstanding or good to requires improvement or inadequate, inspectors found that:
- senior leaders’ actions to improve teaching, learning and assessment were ineffective or too slow
- leaders did not monitor learners’ progress effectively
- not enough apprentices achieved their qualification within the planned time
- teachers or trainers were not challenging learners enough or deepening their knowledge
- learners’ and apprentices’ progress in English and mathematics was not consistent
In the 11 providers inspected for the first time and judged as requires improvement, inspectors found that:
- quality assurance and improvement arrangements for teaching, learning and assessment lacked rigour
- tutors and assessors did not take sufficient account of learners’ starting points to plan and deliver learning that met their needs, nor set challenging enough targets, nor provided good enough feedback to help learners progress as well as they might
- learners were not given sufficient opportunities or support to improve their English and mathematics skills
In the 6 providers inspected for the first time and judged inadequate, inspectors found that:
- managers did not have a clear understanding of the strengths and weaknesses of the quality of teaching, learning and assessment they provided, and therefore did not know how to improve it
- those responsible for governance were not effective in holding leaders and managers to account for ensuring high-quality provision
- staff did not assess the skills that learners had prior to enrolling on courses
- teachers and assessors failed to improve learners’ English and mathematical skills effectively
- leaders and managers failed to implement safeguarding policies and practices
This year, we inspected 9 ILPs that were delivering the majority of their training through Advanced Learner Loans. Of these 9, 5 were judged as requires improvement and 2 inadequate. Although a small group, the quality of education being delivered through these providers remains a concern.
The quality of apprenticeships
This year, we introduced new provider monitoring visits for providers that we had not yet inspected and that were receiving their funding through the apprenticeship levy. Due to the large growth in the number of providers entering the market, we visited a sample of these providers to find out whether there was a potential risk to the quality of apprenticeships. As a result, the Department for Education has funded us to carry out monitoring visits to all newly directly funded providers of apprenticeship training provision from October 2018.[footnote 71]
We also continued to inspect and judge the apprenticeship provision being offered by providers across the sector.
Our inspections and monitoring visits report on apprenticeships delivered from level 2 to level 5.
Inspection outcomes
This year, we inspected the apprenticeship provision of just over 110 providers. We found 58% of these providers to be good or outstanding for apprenticeships. This was 9 percentage points higher than last year.
Two out of three apprentices recorded at the time of inspection this year were receiving good or outstanding apprenticeship provision. This was because the good and outstanding providers were generally training larger numbers of apprentices.
Across a sample of 30 providers that had good or outstanding apprenticeship provision, inspectors found that:
- staff worked very closely with employers to plan the curriculum so that it met the specific training requirements of the business
- managers monitored meticulously the progress that apprentices made on their programmes
- staff intervened appropriately when apprentices fell behind in their work and provided effective support so that the apprentices caught up quickly
In a sample of 30 providers that had less than good apprenticeship provision this year, inspectors found that:
- staff did not use the results of assessments completed at the start of the programme to plan apprentices’ learning
- the apprenticeship was accrediting skills that the apprentices already had
- staff failed to involve employers when planning the apprenticeship
- apprentices did not receive their entitlement to planned off-the-job learning
Outcomes from the 61 new provider monitoring visits are summarised in Table 5 below.
Table 5: New provider monitoring visit outcomes, between 1 February 2018 and 31 August 2018

We judged most of the providers to be making at least reasonable progress in all areas. Just under a fifth of providers were making insufficient progress in at least one area. A further fifth were making significant progress in at least one area.
When a provider is making insufficient progress towards safeguarding its apprentices, we will carry out an additional monitoring visit to inspect this aspect of its provision within 4 months of the previous visit. We revisited one provider during 2017/18 for this reason and judged it to be making significant progress.
The quality and management of subcontractors
We inspect providers that are directly funded by the government to deliver education, training and/or apprenticeships. These providers may choose to contract with an organisation, known as a subcontractor, to deliver part of their provision. The provider receiving the funding is still responsible for managing the subcontractor and the quality of provision it provides.
Since 31 August 2017, we have seen the number of standalone subcontractors drop by nearly half. Nearly two thirds of these subcontractors have become providers in their own right, most entering the market as an apprenticeship provider that will need to be inspected.
Of the 1,680 providers subject to inspection, around a third declared that they would subcontract part of their provision in 2017/18. They contracted with 1,030 subcontractors, of which fewer than half were standalone subcontractors that did not receive any direct funding from the government.
Figure 26: Number of providers that were also a declared subcontractor, 2017/18

Inspection evidence from 2017 showed that poor management of subcontracted education and training could be a reason for poor quality provision. From February 2018, we increased our focus on the management and quality of subcontracted provision during inspections. We:
- increased inspection resource, especially when a provider contracted with multiple subcontractors
- carried out a sample of risk-based monitoring visits
- included more information about subcontracting in our published inspection reports
Inspection outcomes
From 12 February 2018, we increased our reporting on subcontracting in inspection reports. Of the 80 full inspections we carried out between 12 February and 31 August 2018, 39 providers had active subcontracting arrangements in place and 5 providers had stopped using subcontractors within the year.
From a sample of 30 inspection reports, inspectors found that just over two thirds of providers were managing their subcontractors effectively. Similarly, two thirds of the subcontractors were delivering good quality provision.
Twenty-five inspection reports commented on the progress and/or achievement of learners registered with the subcontractor. In three quarters of these providers, inspectors found that learners registered with the subcontractor were making progress and achieved their qualifications in line with or better than their peers registered with the main provider.
In the providers that were managing their subcontractors effectively, inspectors found that:
- managers had reliable information about learners’ performance within the subcontractor and monitored them closely
- the provider met with subcontractor(s) regularly and carried out teaching, learning and assessment observations
- if performance declined, the provider was swift to take action and helped the subcontractor to improve
- if a subcontractor could not improve, the provider ended the contract
General further education colleges
In September 2015 we launched the current common inspection framework. Under this framework, when colleges merge, they do not carry forward their separate, previous inspection outcomes. They are treated as new providers, normally receiving their first full inspection within 3 years of the merger. We continue to risk-assess these colleges annually and monitor them closely. We may carry out monitoring visits or support and challenge visits to assess risk. If we are concerned that a college is not making sufficient progress after its merger, we bring forward the inspection.
Since 1 September 2015, a total of 94 general FE colleges, sixth form colleges and other providers have been subject to a merger, creating fewer, but larger colleges. They formed 39 new general FE colleges, 3 sixth form colleges and one specialist designated institution.
Figure 27: Number of colleges by the number of learners, for colleges that have merged since 1 September 2015

Eighteen of the mergers were between colleges judged good or outstanding and colleges that required improvement or were inadequate. Five were between colleges both judged requires improvement and/or inadequate. We have continued to evaluate the progress of any former college that was judged requires improvement or inadequate through support and challenge or monitoring visits since it merged.
The mergers are creating much larger colleges. Twice as many colleges as before now offer places to over 10,000 learners. Some of these colleges have more than 20,000 learners – that is the equivalent, on average, to the number of pupils in 20 secondary schools.
Inspection outcomes
On 31 August 2018, there were 178 general FE colleges, of which we had inspected 140. Thirty-seven merged colleges and one new college were awaiting their first full inspection within 3 years.
This year, we inspected 26 general FE colleges that previously required improvement. Eighteen improved to good compared with only 7 out of 20 last year.
This improvement was reflected in the proportion of general FE colleges judged good or outstanding at their most recent inspection. It increased by 9 percentage points, from 67% on 31 August 2017 to 76% on 31 August 2018.
This year, 18 colleges improved from requires improvement to good. At their previous inspections, inspectors had reported that renewed leadership teams had developed a clear direction for each of the colleges and were focused on improving the quality of teaching, learning and assessment, but had yet to demonstrate impact. This year, inspectors found that:
- leaders and governors were focused on improvement and had created a culture of high aspirations for staff and learners
- teacher monitoring was effective and lesson observations helped to correctly identify areas for improvement
- high-quality training was available to teachers
- the performance management of teachers was effective
- the quality of teaching had improved
- nearly all learners had consistently good outcomes
There were 7 colleges that remained requires improvement at inspection this year. Five of the colleges were judged requires improvement for a second time. One college remained less than good for a fourth consecutive inspection.
The colleges had new leadership teams in place either at this inspection or at their previous inspection. In 5 of the colleges, inspectors found that improvements had been made but it was too early to see the full impact of these changes. In particular, teaching, learning and assessment were not yet consistently good across each of the colleges.
Following the risk assessment this year of 43 colleges that had formed from a merger, we brought forward the inspections for 3. Two were judged to require improvement and one was good. The colleges that required improvement were a mix of previously good and requires improvement colleges that had merged. One college has since gone on to merge again.
Community learning and skills providers
Community learning and skills providers deliver community learning, education and training and apprenticeships designed to help people of all ages and backgrounds. They specialise in engaging learners who are economically and/or socially disadvantaged. They help learners to improve their personal, social and employability skills. Learning often takes place in community settings, such as schools, libraries and children’s centres.
Most providers offer courses at level 2 or below, including courses that do not lead to a formal qualification (non-accredited). In recent years, there has been a shift towards focusing more on courses in English, mathematics and information, communication and technology (ICT). However, health and well-being, and arts and culture courses that help individuals to gain confidence, progress to further learning and create opportunities for social interaction remain an integral part of the curriculum offer in this part of the sector.
On 31 August 2018, there were 222 community learning and skills providers, made up of 139 local authorities, 72 not-for-profit organisations with charitable status and 11 specialist designated institutions. They were delivering training to around 650,000 learners.[footnote 72]
The numbers of adults participating in government-funded education and training programmes continues its year-on-year decline.[footnote 73]
- Overall participation declined by 3% over the first two quarters of 2017/18 compared with 2016/17. This follows a 4% decline between 2015/16 and 2016/17.
- There were declines in the number of adults participating on level 2 courses, English and mathematics qualifications and in the number of learners on community learning funded programmes.
- However, the number of adults participating on level 4 courses had increased over time and there was a small, recent, increase in the number of learners taking English for speakers of other languages (ESOL).

Inspectors saw a wide range of activity to support adult learners in their communities this year that included:
- high-quality training in mentoring and counselling for learners recovering from drug and alcohol misuse
- ESOL courses to help refugees and nurses recruited from overseas to improve their spoken English
- family learning courses for parents so that they can help support their children in learning to read, write and count
- programmes that focus on developing independence, social and employment skills for learners who have learning difficulties and/or disabilities
- work with the police service to help learners remove themselves from gang culture and law-breaking
Inspection outcomes
On 31 August 2018, we had inspected 220 of the 222 community learning providers, with the 2 remaining new providers waiting for their first full inspection.
This year, we inspected 75 community learning and skills providers. This year, 17 out of 24 providers that previously required improvement or were inadequate improved to good. This increased the proportion of providers judged good or outstanding at their most recent inspection by 5 percentage points, from 83% on 31 August 2017 to 88% on 31 August 2018.
In the 17 providers that improved to good this year, inspectors found that the most common areas of improvement were that:
- leaders and managers had successfully improved the number of learners achieving their qualifications or personal learning goals on non-accredited courses
- leaders and managers had made improvements to the quality of teaching, learning and assessment through improved performance management
- governance arrangements had been strengthened
- subcontractors were being managed more effectively
- leaders and managers had raised expectations and aspirations for their learners
Sixth form colleges and 16 to 19 academies
Around 90% of the 185,000 learners being educated and trained by sixth form colleges and 16 to 19 academies are aged under 19.[footnote 74], [footnote 75]
Nearly a third of the original 90 sixth form colleges have academised or merged over the last 2 years. This has reduced the number we report on, from 79 on 31 August 2017 to 61 on 31 August 2018.
Conversely, the number of 16 to 19 academies has more than doubled over the last 2 years, from 21 to 46 by 31 August 2018. This expansion was almost entirely caused by the academisation of sixth form colleges. The 46 academies are made up of:
- 20 original 16 to 19 academies that were set up by 31 August 2016 (one has since closed)
- 20 sixth form colleges that have academised
- 6 new academies that have become FE and skills providers since 31 August 2016
Inspection outcomes
Of the 61 sixth form colleges operating on 31 August 2018, 81% were judged good or outstanding at their most recent inspection. This was a one percentage point increase from the previous year.
In the 4 sixth form colleges that improved to good this year, the most common areas of improvement inspectors found were that:
- managers had implemented effective staff development for teachers
- leaders and staff had improved the quality of teaching, learning and assessment
- leaders and managers had reduced the gap in achievement between different groups of learners
- teachers’ confidence in developing students’ English and mathematical skills had been improved
On 31 August 2018, we had inspected 38 16 to 19 academies, with a further 8 academies waiting for their first full inspection.[footnote 76]
On 31 August 2018, more than three-quarters of these academies were judged good or outstanding at their most recent inspection. This was a 6 percentage point increase from the previous year, which was largely caused by sixth form colleges that converted to 16 to 19 academies becoming part of this group and bringing their previous good or outstanding inspection grade with them.
We had inspected 19 of the original 20 academies by 31 August 2018.[footnote 77] At their first inspection, 7 were judged to be outstanding and 4 good. We have re-inspected 9 academies since their first inspection and 7 of these improved their overall effectiveness judgement.
However, 3 academies have been judged requires improvement and/or inadequate in each of their last 3 inspections. In 2 academies, the foundations to secure improvements in teaching, learning and assessment and outcomes for learners were present, but it was too soon to see a sustained improvement. The future sustainability of another academy was at significant risk because leaders and managers had been unable to meet learner recruitment targets in recent years, despite the concerted actions they had taken.
A sixth form college that converts to become a 16 to 19 academy will retain its latest inspection outcome and we will inspect it in line with the timeframes set out within the FE and skills inspection handbook. By 31 August 2018, we had inspected 3 of the 20 sixth form colleges that converted. One remained good after a short inspection and 2 declined from good to requires improvement following a full inspection.
Independent specialist colleges and high needs provision
Independent specialist colleges (ISCs) offer provision for learners who have a learning difficulty and/or disability (LDD). The number of ISCs operating across England has increased in recent years, as a result of changes brought about through section 41 of the Children and Families Act 2014. This set out new rules that allowed more providers to be recognised as specialist post-16 institutions.
High-needs funding is available to any FE and skills provider that is delivering education or training to:
- students aged 16 to 18 with high levels of SEND and who receive top-up funding from the high needs budget
- learners aged 19 to 25 who have an education, health and care plan and require additional support costing over £6,000[footnote 78]
Inspection outcomes
On 31 August 2018, there were 80 ISCs. We had inspected over three-quarters of the providers, with a further 12 new ISCs waiting for their first full inspection.
During 2017/18, we inspected 30 ISCs. Twenty were judged good or outstanding. We inspected 9 ISCs for the first time and found 6 to require improvement.
The outcomes from the ISCs we inspected for the first time this year, along with 2 good ISCs closing, had a negative effect on the most recent outcomes for all ISCs. The proportion judged good or outstanding declined by 6 percentage points, from 82% on 31 August 2017 to 76% on 31 August 2018.
In the 6 ISCs that we inspected for the first time this year and that required improvement, inspectors found that:
- the quality of teaching, learning and assessment was not good enough
- teachers and tutors were unclear of the progress students were making
- leaders and managers did not accurately assess the quality of their provision or put in place clear actions for improvement
- learners were not benefiting from impartial careers advice and guidance
- too few learners were progressing towards and/or achieving their English and mathematics qualifications
- governors lacked rigour in their actions; they did not challenge and support college leaders and managers effectively to bring about improvements
The provision for learners with high needs was judged across a range of providers this year. Of the 67 providers inspected, 72% were judged to be good or outstanding. This was similar to last year.
Across the 5 general FE colleges and 2 independent specialist colleges that we judged outstanding for their high needs provision, inspectors found that:
- arrangements to ensure that learners transitioned successfully from school to college were excellent
- leaders and managers had high expectations for the learners
- learners had highly effective personalised programmes of study
- teachers and staff monitored and tracked learners’ progress extremely well
- teachers provided excellent support to help learners develop their English and mathematical skills
- almost all learners were benefiting from extremely well-planned work experience placements
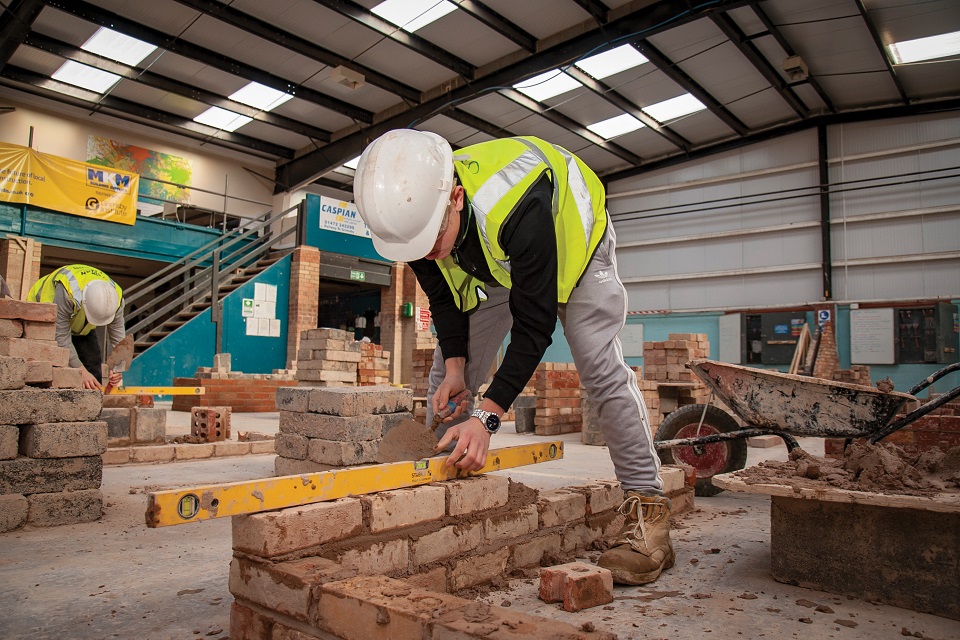
Education, skills and work in prisons and young offender institutions
We work with Her Majesty’s Inspectorate of Prisons to inspect the quality of education delivered in prisons and young offender institutions (YOIs). On 31 August 2018, there were just over 110 prisons and YOIs, all of which we have inspected for their provision of education, skills and work.
When offenders enter the prison system, staff assess their educational starting points to create an individual learning plan. Around two-fifths of the prison population go on to participate on courses at level 2. The number participating on level 3 courses has been in decline over time, dropping from a peak of 2,400 in 2012/13 to a low of 100 in latest published data.[footnote 79]
Inspection outcomes
We contributed to 41 prison and YOI inspections for which the reports were published between 1 September 2017 and 31 August 2018. We judged 39% of prisons and YOIs to be good for the overall effectiveness of education, skills and work.[footnote 80] None were outstanding. This is 17 percentage points lower than the proportion judged good or outstanding last year.
Figure 28: Overall effectiveness of education, skills and work in prisons and young offender institutions, by reporting year

Of the 21 prisons and YOIs that previously required improvement, 7 improved to good. This, along with 6 providers receiving a good overall effectiveness judgement for the first time, increased the proportion of prisons and YOIs judged good or outstanding at their most recent inspection by 6 percentage points, from 42% on 31 August 2017 to 48% on 31 August 2018.
Table 6: Overall effectiveness of education, skills and work in prisons and young offender institutions published between 1 September 2017 and 31 August 2018, by previous overall effectiveness grade

However, overall improvement was too slow. Eleven prisons and YOIs inspected this year showed improvement; 5 of these had improved from inadequate to requires improvement, with one YOI going on further to improve to good at their second inspection. However, 18 prisons and YOIs either remained requires improvement or inadequate this year or declined to either grade. This includes one prison that was inspected twice this year and remained requires improvement at both inspections.
Urgent action is needed to ensure that prisons – and more specifically, under-performing ones – are helped to improve. At present, we are working closely with the Ministry of Justice to identify alternative ways of inspecting that will support prison leaders to raise the standards of the quality of education, skills and work in their establishments. We continue to work alongside Her Majesty’s Inspectorate of Prisons to ensure that the education, skills and work provision are evaluated as part of a full prison inspection.
Typically, when a prison is underperforming, inspectors find that:
- learners’ access to learning activities are limited, as staff shortages cause units to be locked down and education classes to be cancelled
- there are not enough full-time education, skills and work activity places to meet the needs of the prison population, particularly in overcrowded prisons
- senior managers fail to develop and put in place reliable and effective measures to monitor and improve the quality of lessons and activities
- the range of education, work and vocational training is not broad enough to prepare prisoners well for life after prison
- prisoners engaged in work activities do not have a clear understanding of what they had achieved, including personal and social skills, because instructors do not identify or record the skills they develop; this means that prisoners have little useful information to take with them when transferring to another prison or when being released
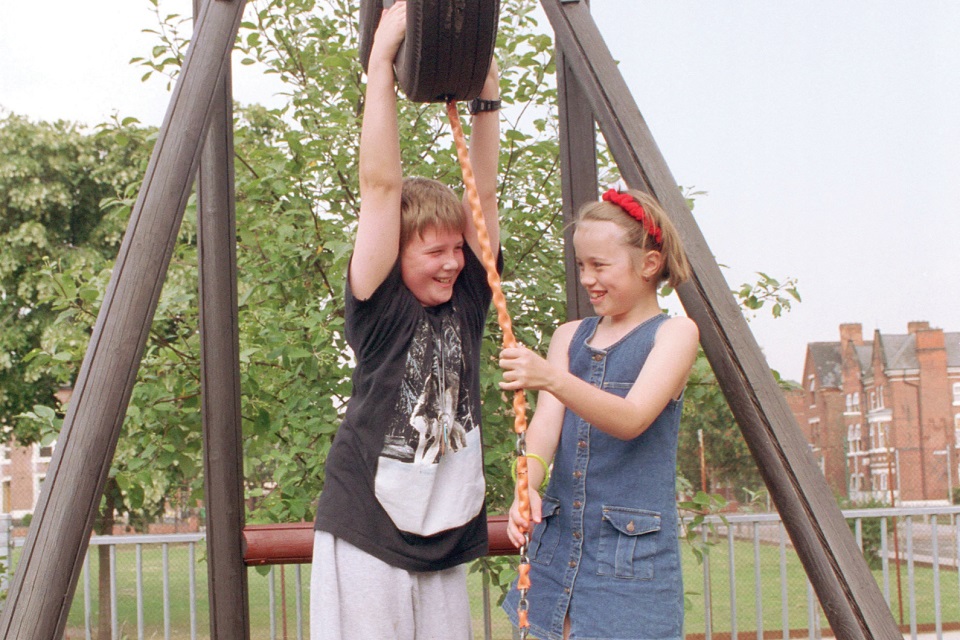
Social care
In this section:
Local authorities
There are almost 12 million children and young people in England.[footnote 81] The 152 English local authorities’ (LAs) children’s services impact around 400,000 children in need in England each year.[footnote 82] More than 75,000 of these children are children in care.[footnote 83], [footnote 84] We inspect these LAs to see how their children’s services are performing.
Section overview
Currently, 42% of LAs are judged good or outstanding, 45% as requires improvement to be good and 13% inadequate. This is an improvement from last year, when 36% were good or outstanding.
We monitor inadequate LAs and then re-inspect them. We have seen two-thirds of inadequate LAs improve at their re-inspection, some even to good. Seven LAs, though, are struggling to improve.
This year has seen the introduction of a new inspection framework for LAs. The framework includes new inspection types and LA engagement meetings.
At the end of 2017, we finished the single inspection framework (SIF) cycle of inspections of LAs. Between November 2013 and November 2017, we carried out 159 SIF inspections in 152 LAs.[footnote 85]
In the last year, we have carried out 142 inspections and visits in 88 LAs. In addition, we have carried out joint targeted area inspections (JTAIs) in 7 LAs. We have also held annual engagement meetings with almost every LA.
Figure 29: Number of local authority inspections and visits carried out in 2017/18

Inspection outcomes
The final 6 SIF inspections carried out this year resulted in 5 LAs being judged good and one as requires improvement to be good.
The first of the new inspections of local authority children’s services (ILACS) are showing that most LAs and their overall judgements are improving. Only one LA has declined since its SIF inspection. Of the 16 LAs inspected, 3 were judged outstanding, 8 good, 4 requires improvement and one inadequate. One of the outstanding LAs was also the first LA to be judged outstanding in all areas judged.
Most of the previously inadequate LAs improved at their SIF re-inspection. Of the 21 LAs to have received SIF re-inspections, two-thirds improved from inadequate. Three were judged to be good and 11 to be requires improvement.
Table 7: Number of local authority inspections in 2017/18 that resulted in an inspection judgement and compared with previous SIF judgement

Nationally, the overall effectiveness of LAs continues to improve. When looking at the latest national picture compared with the picture after each LA’s first SIF inspection, the proportion judged good or outstanding has improved from 36% to 42%. There has been a large decrease in the proportion judged inadequate, from 22% to 13%.
Figure 30: Overall effectiveness of local authorities at their most recent inspection, at various points in time

The improvement in LA performance should be acknowledged because there often appears to be a public perception that LAs are failing children. This is reinforced through, among other things, the awful events around grooming. Grooming gangs are a potential challenge in all LA areas. However, practice over the past 4 years has improved exponentially, leading to a wholly different response to vulnerable adolescents. Many of the high-profile prosecutions of these gangs still relate to practice that pre-dates the watershed moment that was the Jay report.[footnote 86] Overall, the LA children’s services sector is a service demonstrating improvement, albeit not everywhere.
Some LAs that fail in a relatively small number of judgement areas have the capacity, with the right level of support and challenge, to turn things around relatively quickly. Then there are those LAs that require longer and more significant intervention, but still achieve impressive improvement. Finally, there are those LAs in which the weaknesses are so great and the infrastructure insufficient that the inadequacy is far more entrenched. These are the LAs that take the longest time to improve and help fuel the public perception of poor performing LAs.
The overall picture of improvement across the country can be seen by the darker colours in the map below.
Figure 31: Map of local authorities by their most recent overall effectiveness judgement, 31 August 2018

Forty-one per cent of children in need are from good or outstanding LAs. Children in care are slightly less likely to be from good or outstanding LAs (39%) than children in need.[footnote 87]
Figure 32: Proportion of various populations of children and young people, split by LA overall effectiveness judgement

The improving judgement profile of LAs means that more children in need and children in care are now from outstanding or good LAs.[footnote 88] In the last year, more than 28,000 children in need and just under 6,000 children in care have seen their LA improve from inadequate. While this is a welcome change, there are still over 65,000 children in need and more than 12,000 children in care from inadequate LAs.
Monitoring inadequate local authorities
To support LAs in improving their services for children, we carry out quarterly monitoring visits to those judged inadequate. This year, we have carried out 66 of these monitoring visits to 24 inadequate LAs.[footnote 89] Twenty-two of these had been judged inadequate in the area of children in need of help and protection. Just under half (11 of 24) had been judged inadequate for children looked after.
Seven LAs were judged to still be inadequate at their re-inspection. Common features of LAs that struggle to improve from inadequate are:
- a failure to address longstanding weakness and their general pace of improvement
- insufficient staff and managers, including failures to recruit and retain them and the resultant high caseloads
- the quality of social work practice, including failures to identify risk and delay in both protecting and achieving permanent alternatives for children
- a lack of purposeful management oversight of practice
Focused visits to local authorities
The ILACS framework introduced a new type of visit to LAs: the focused visit. These visits are for inspectors to evaluate an aspect of service, a theme or the experiences of a cohort of children. We do not make graded judgements at focused visits, but instead publish our findings about strengths and areas for improvement within the LA. This year, we carried out 39 focused visits.
Table 8: Theme, aspect of service, or experience of a cohort of children looked at during focused visits
| Area looked at | Number of visits |
|---|---|
| Achieving permanence | 3 |
| Care leavers | 4 |
| Children in care | 1 |
| Children in need/subject to a plan | 9 |
| Front door[footnote 90] | 18 |
| Vulnerable adolescents | 4 |
Includes visits carried out between 1 January 2018 and 31 August 2018 that had a report published by 30 September 2018. Source: Ofsted
Joint targeted area inspections of local authorities[footnote 91]
In the last year, we have carried out JTAIs looking at 2 themes: the neglect of older children; and children at risk of exploitation. We inspected 6 LAs for the neglect JTAI and 3 LAs for the children at risk of exploitation JTAI.[footnote 92] In both, we found clear themes and messages about how to improve multi-agency responses to vulnerable older children. HMCI’s commentary at the start of this Annual Report has further details.
Regulated and other providers
There are more than 75,000 children in care in England.[footnote 93] We inspect and/or regulate most of the providers that care for these children. There are almost 3,000 social care providers and providers of residential accommodation in boarding schools and further education colleges.[footnote 94], [footnote 95]
Section overview
Currently, 84% of the almost 3,000 social care providers are judged good or outstanding. Fourteen per cent are requires improvement to be good and 2% are inadequate. The performance of secure training centres, however, continues to be a concern. We have not judged any to be good or outstanding and we hold serious reservations about their performance.
Staff qualification levels in children’s homes are far below where the government expected them to be in 2018. More than a third are not qualified to, or are working towards, the required level 3. Less than half of children’s homes registered managers held the required level 5 qualification.
Most children in care are placed in or through a fostering agency and the numbers of these children are increasing year on year. Yet at the same time, the number of fostering households continues to decline. Also of concern is that the proportion of young people staying with their foster carers past their 18th birthday fell by 8 percentage points.
More than three-quarters of social care providers are children’s homes.* This year, the number of homes has continued to rise. The proportion of homes run by LAs, though, has continued to fall this year. Within the overall rise, the very largest private and voluntary owners continue to open the largest proportion of new homes each year. However, despite opening most new homes, these large providers are not always providing similar levels of coverage across all regions.
The volume of enforcement action we have taken has continued to increase. Suspensions have increased ten-fold in the last 3 years and cancellations have more than doubled. Enforcement action this year has also included us cancelling the registration of one entire chain of children’s homes.
* Throughout this annual report where we refer to children’s homes we mean all 3 types of children’s homes unless we specifically state otherwise. These 3 types are residential special schools registered as children’s homes; secure children’s homes; and all homes that do not fall into one of the previous 2 categories.
In the last year, we have carried out over 3,500 inspections and visits to social care providers. These included 2,600 full inspections, 600 interim inspections and over 300 monitoring visits.
Figure 33: Number of social care providers at 31 August 2018, and number of inspections carried out in 2017/18

Inspection outcomes
Due to varying inspection cycle lengths for different provider types and the scope of this report being an academic year rather than financial year, the providers inspected in 2017/18 are not necessarily representative of social care providers as a whole. Of the 2,600 full inspections, 18% resulted in an outstanding judgement, 59% a good judgement, 16% requires improvement and 7% inadequate.
In 2018, 84% of social care providers were judged good or outstanding at their latest inspection, the same as last year. Residential holiday schemes for disabled children have the highest proportion of good or outstanding providers, at 100%. Secure training centres have the lowest proportion, with none judged good or outstanding.
Figure 34: Overall effectiveness of active social care providers at their most recent inspection, 31 August 2018

The very best children’s homes achieve a good or outstanding judgement year after year, providing a high-quality service for the children they care for. Looking at homes that have been running for 10 or more years, 12% have always been judged good or outstanding. The strengths of the very best homes include:
- stable staff teams made up of dedicated, experienced and often highly qualified staff and managers
- strong partnership work with other professionals, community groups, parents and families to improve outcomes and provide integrated care
- quality relationships between staff and the children; staff nurture and trust the children, are open and honest with them, show them warmth and respect them
- a good range of quality experiences and activities that children can access
- listening to the voice of the child and involving them in decisions, no matter what their ability to communicate is
Active homes stuck at requires improvement or inadequate at every inspection are far less common than homes that are judged as good or outstanding at every inspection. The longest any home has been stuck is 4 years, with 2 homes falling into this category.
As part of the social care common inspection framework (SCCIF), we introduced risk assessment when scheduling children’s homes inspections. Good or outstanding homes now only receive an interim inspection if we have reason to be concerned about them.[footnote 96] This has meant a reduction of more than two-thirds in the number of interim inspections (576 interim inspections in 2017–18 compared with 1,823 in 2016–17). Only 27% of homes judged good or outstanding in 2017–18 received an interim inspection later in the year.
This year, we reviewed the first 12 months of the SCCIF. We wanted to ensure that it was focused on what matters to children’s lives, brought consistency to our expectations of providers, and was proportionate in approach.
Findings confirmed that, overall, the SCCIF has been well received by providers and the inspection workforce. Inspectors are spending more time with children and families, and less time looking at policies and procedures. Reports demonstrate the impact of services on the lives of children more clearly. However, we did find that more could be done to ensure consistency of approach not only between inspectors but also across regions. We will be acting on the findings in the coming months. We will begin evaluating the impact of the SCCIF in 2019.
Providers and places
Over three-quarters of social care providers are children’s homes. There are around 6,000 children in homes at any one time in the year.[footnote 97] While independent fostering agencies (IFAs) are a smaller proportion of providers, they care for far more children in care – around 17,000.[footnote 98]
This year saw an increase of 4% (77) in the number of homes, continuing the trend that began in 2016 of increasing numbers of children’s homes. There are many reasons why the number of homes is increasing, but the continuing national need for local specialised care is one of the main ones.
While the total number of homes in England continues to increase, the number of homes run by LAs has fallen from 26% in 2012 to 18% in 2018.
There are now 43 LAs (28%) that do not own any children’s homes and commission residential places they use for children in their care. Excluding homes that provide short-break care only, the number rises to 60 LAs (39%). This leaves 92 LAs that can place their children in care in the LA’s own homes as well as in homes that the LA commissions residential places in.
Fostering
The latest fostering data from March 2017 shows that the number of fostering households across both IFAs and LA fostering agencies continues to fall (43,710 in 2017 down from 44,320 in 2016).[footnote 98] There has been a decrease of 2% since March 2014. Although family and friends fostering only makes up 15% of all fostering households, it has increased for the second consecutive year, this time by 11%. Overall, though, there are fewer foster places available than last year.
The number of children placed through IFAs and LA fostering agencies in 2017 remained the same, at around 52,000. However, the proportion of children staying put with their foster carers after their 18th birthday decreased by 8 percentage points (46% compared with 54% in 2015–16).[footnote 99] This follows a 4 year period of relatively steady figures. The reason for this fall is unclear but is a concern because it may mean fewer young people having the opportunity for stable home lives at this important point of transition into adulthood.
Large social care providers
Large social care providers are organisations other than LAs that own 10 or more children’s homes. On 31 August 2018, there were 34 large social care providers.[footnote 100]
The proportion of homes owned by large providers continues an upwards trend. In 2017–18, large organisations also continued to open the highest proportion (32%) of all new children’s homes.[footnote 101], [footnote 102]
Table 9: Percentage of children’s homes and beds owned by large providers at various points in time

The proportion of homes owned by large providers varies considerably across regions, from 51% to 9%. While there are many reasons for this variation, the price of suitable property may play a part.
Figure 35: Percentage of children’s homes run by large social care providers by region

Overall, homes run by all large organisations achieve a higher proportion of good or outstanding grades (84%) than homes run by other private and voluntary providers (80%). They also have proportionally fewer inadequate judgements. However, the proportions vary considerably from organisation to organisation.[footnote 103]
The IFA market also has some large organisations. The 5 largest organisations each have over 1,000 fostering places. Between them, they have over 13,000 places, which is 44% of the IFA market.[footnote 104] They have a better judgement profile than all the other IFA providers grouped together.
Figure 36: Overall effectiveness of IFA providers at 31 August 2018

Staffing in children’s homes
Effective social care providers need suitably qualified staff. Getting the right qualification can help staff better support the children they care for. We collect data on staff qualifications from children’s homes when we inspect them.
The 2017–18 data shows that 46% of staff had the required level 3 qualification and another 18% of staff were working towards one.[footnote 105], [footnote 106] LA-run homes had the highest proportion of qualified staff (61%) compared with 46% in private homes and 29% in voluntary-run homes. When staff working towards the qualification are added in, the proportions are much closer between LA and private homes (72% and 69%).
The government planned that most children’s homes’ staff would be qualified by this year. It is extremely disappointing this has not been achieved. Our inspectors will continue to take any lack of staff qualifications, and the impact of this on the care and welfare of children, into account when considering the inspection judgement or taking enforcement action.
Good or outstanding homes are more likely to have higher proportions of staff with level 3 qualifications.
Figure 37: Percentage of staff qualified to level 3 by overall effectiveness judgement of home

The 2017–18 data shows that 47% of homes had a registered manager (RM) with a level 4 qualification or above.[footnote 107] Homes that were outstanding or good were more likely to have an RM with at least a level 4 qualification (58% and 48%, respectively). Homes that were judged as requires improvement (40%) and inadequate (30%) were less likely.
When the RM in a children’s home changes, it can be a difficult and worrying time for both the staff and children. The best homes ensure that, when possible, these changes are planned, minimising any destabilising impact on staff and children.
Homes that change RM are slightly more likely to change judgement (49%) than homes that keep the same RM (44%). They are as likely, though, to improve as to decline. A change in RM had the biggest impact at either end of the judgement scale. For high-performing homes, a change of manager can often be a negative thing: outstanding homes were far more likely to decline (69% compared with 46%) when they changed RM. However, for inadequate homes it is usually a good thing: they were more likely to improve (94% compared with 83%) when they changed RM.
Children and young people in social care provision
The education that all children and young people receive while in care is vital to their future prospects. This year, 70% of children and young people in children’s homes were listed as having a school placement, 8% as having a college placement and 9% as having a placement in an alternative provision.[footnote 108] Four per cent were listed as not in education or awaiting a placement.
The results of our latest point-in-time surveys show that children feel helped and supported in their education.[footnote 109] Additionally, 95% (children’s homes: 92% and fostering agencies: 98%) said that they are helped and supported by their staff/carers all or most of the time. Further, most children were told in an effective way why they were looked after, with 93% (a 6 percentage point increase) responding that this was the case.
The surveys also showed that there is more work to do in telling children useful things about the children’s home/foster family they are moving to before they start their placement. Only 53% of children who responded said that they found out useful things. Also, the proportion of children who answered that their staff member/carer rarely or never helped them if someone had picked on them or upset them increased to 9%, from 3% last year.
Secure accommodation
The number of places available in the 2 types of secure provision are similar: 231 in secure children’s homes (SCHs) and 223 in secure training centres (STCs). However, more than half the places in SCHs are allocated to LAs for welfare placements.[footnote 110] Children in SCHs have the most significant and highly complex needs, including around mental health. The availability and number of welfare places remain ongoing concerns for LAs. These issues raise the potential for the use of unregulated provision.
SCHs (86% judged good or outstanding) achieve better judgements than STCs (none of which are judged good or outstanding). This was still the case this year, despite one SCH being judged inadequate. SCHs’ strengths include:
- staff who consistently develop positive relationships with children and consult them about their care and the running of the home
- effective assessment and planning for children’s needs
- positive educational progress and outcomes
- good relationships with safeguarding partners
- good planning, support and delivery of transition
Areas for improvement typically include shortfalls and inconsistencies in recording, especially about measures of control.
We remain concerned, as we were last year, about high levels of violence in STCs and the safety of children and staff. We are also concerned about how STCs understand and use risk management and safeguarding procedures. STCs lack consistency in management positions. Two STCs still have difficulties in recruiting, retaining and developing staff. All 3 STCs struggle to ensure that staff at all grades have the appropriate skills and knowledge base to provide and care appropriately for the children placed there.
Complaints and child protection notifications
As well as inspecting, we are also the regulator and as such are legally responsible for investigating concerns raised about the quality of children’s social care providers. These complaints are categorised by us, with category 1 complaints being the most serious and usually involving child protection concerns. There is a range of actions we may take, including carrying out an investigation visit, carrying out an inspection or looking at the concern at the provider’s next inspection, and asking the provider to investigate.[footnote 111]
In 2017/18, we received just over 1,000 qualifying complaints about more than 800 social care providers. Children’s homes had the most complaints made about them. Boarding schools had the highest proportion of category 1 concerns raised, albeit from very small numbers of complaints.
Figure 38: Percentages of complaints by category and provider type

We also receive child protection notifications from social care providers. We received most child protection notifications (73%) from children’s homes. IFAs made 23% of the notifications.
Enforcement
As the regulator, we have legal powers to take enforcement action when required.[footnote 112] There is a range of enforcement actions we can take, the most serious being restricting accommodation for a provider, suspending a provider or ultimately cancelling a provider.[footnote 113]
Figure 39: Numbers of most serious social care enforcement action taken by year

The number of serious enforcement actions we have taken against social care providers has increased over the last 2 years. So far this year, the upward trend shows no signs of stopping.
There is a range of reasons why enforcement action numbers have increased. These include:
- the cancellation of 2 entire chains of children’s homes
- updated legal advice to help us ensure that children are safe and receiving high standards of care
- increased inspector capacity to take more robust enforcement action following the reduction in children’s homes interim inspections
The number of cancellations has doubled since 2015–16 and has already increased again this year. The main reasons for the cancellation of providers were:
- concerns about safeguarding children
- concerns about the provider’s suitability
- a history of concerns combined with the provider failing to take effective action
The number of suspensions has increased almost ten-fold since 2015–16. In 2017–18, there were 29 suspensions and 2018–19 has seen 14 already in the first 5 months of the year. Part of this increase is due to suspensions now often being issued when we start the cancellation process against a provider.

Most providers (85%) that are suspended receive only a single suspension before rectifying the issue(s). In the last 3 years, 40% of the providers that have been suspended have ceased to operate. This is either through voluntarily cancelling or through us cancelling their registration.
Over the last 3 years, we have issued 135 restrictions of accommodation to 94 providers.[footnote 114] Most providers close, either voluntarily or through us cancelling them, after receiving a restriction of accommodation.
The main reasons for restricting accommodation were weaknesses in:
- safeguarding children
- leadership and management/staffing
- risk management
- admissions and care planning
Weaknesses in safeguarding children usually related to poor practice around physical restraint or a failure to respond effectively to children going missing and/or at risk of sexual exploitation.
We also investigate possible unregistered social care provision. When we find that the provider is operating an unregistered provision, we issue a cease and desist letter to them. We also contact the LA that placed the child in the provision. Some of these providers then move to register the service they are offering as a children’s home. If the unregistered setting continued to operate, without registering, we would consider whether to pursue a prosecution.
-
‘Prison: the facts Summer 2018’, Prison Reform Trust, 2018. ↩
-
Early years foundation stage profile results in England, 2017 to 2018’, Department for Education. ↩
-
‘A level and other 16 to 18 results: 2017 to 2018 (provisional)’, Department for Education, October 2018. ↩
-
‘Level 2 and 3 attainment by young people aged 19 in 2017’, Department for Education, May 2018. ↩
-
‘National Child Measurement Programme, England – 2017/18 School Year’, NHS Digital, October 2018. ↩
-
Some referrals were received before the taskforce was set up. ↩
-
‘Annual teachers survey 2018: teachers’ awareness and perceptions of Ofsted’, YouGov on behalf of Ofsted, July 2017. ↩
-
Based on an analysis of the inspection reports of 7 of the schools that declined to inadequate. ↩
-
‘Initial teacher training performance profiles: 2016 to 2017, Department for Education’, Department for Education, July 2018. ↩
-
The term ‘nurseries and pre-schools’ is used throughout to designate childcare on non-domestic premises. ↩
-
Some primary and all-through schools have nursery classes in which they look after children aged between 2 and 4, but these are exempt from registration on the Early Years Register. ↩
-
Early years and childcare providers can also register on the compulsory or voluntary parts of the Childcare Register. We inspect a sample of providers that are not on the EYR each year. Nursery schools are exempt from registration on the EYR. Further contextual information on providers registered with us is available in our early years official statistics. ↩
-
Most deprived and least deprived areas are based on deprivation quintile, calculated from the Income Deprivation Affecting Children Index (IDACI) rank of all lower super output areas. This is based on the provider address, not the area where the children who attend live. ↩
-
Since 1 September 2017, working parents of 3- and 4-year-olds in England have been eligible for 30 hours of free childcare. See ‘Education provision: children under 5 years of age, January 2018’, Department for Education, January 2018. ↩
-
For childminders, the maximum number of places that they can offer if they do not have any assistants is 6. All childminders are recorded as offering 6 places at registration. ↩
-
Some registered persons may form part of the same company. ↩
-
‘Schools, pupils and their characteristics: January 2018’, Department for Education, October 2018. ↩
-
Includes all types of inspections conducted under sections 5 and 8 of the Education Act 2005. A section 8 visit may be deemed a section 5 visit and become a full inspection, which lasts for longer and results in a graded set of inspection judgements. Note the list of events that follow are not mutually exclusive, so do not add to the total of 6,890 inspections. ↩
-
Most inspections of exempt schools are carried out because the school’s performance appears to be declining. However, some are also due to complaints we receive about the schools, or because the school has substantially changed since it was judged to be outstanding (for instance, it has taken on another key stage or merged with another school). ↩
-
Monitoring visits to schools that had a most recent overall effectiveness grade of requires improvement or inadequate. ↩
-
See the Excel file of our official statistics ‘State-funded schools inspections and outcomes’, Ofsted, November 2018, for further details and underlying data. ↩
-
For the back-dated data and an analysis of the impact of the methodology change see ‘Changes to Ofsted’s statistical reporting of inspection outcomes for state-funded schools: an analysis of the changes’, Ofsted, June 2018. ↩
-
For details of the 2 policy consultations and their outcomes, see Short inspections of good schools and Short inspections of good schools: maintained schools and academies. ↩
-
School inspection handbook: section 8, Ofsted, September 2018. ↩
-
Data is for the financial year from 1 April 2017 to 31 March 2018. ↩
-
See pages 32 to 34 of ‘The Annual Report of Her Majesty’s Chief Inspector of Education, Children’s Services and Skills 2016/17’. This includes an analysis of the common features from inspection reports of 38 of the secondary schools that met last year’s criteria. ↩
-
Based on inspections from September 2005 as this is when section 5 inspections began, and the overall effectiveness judgement is broadly comparable from this point onwards. If a school has become an academy, or changed its unique reference number for any other reason, then analysis includes both the current school and the predecessor school. Only schools with 4 or more inspections since 2005 are eligible to be classed as stuck. ↩
-
As a proportion of all schools open on 31 August 2018, regardless of when they opened or how many inspections they have had. ↩
-
From September 2013, we began including in inspections a recommendation that schools review how they use the pupil premium, where appropriate. ↩
-
‘Schools causing concern: guidance for local authorities and RSCs’, Department for Education, November 2018. ↩
-
The indicator of free school meals used is pupils in receipt of free school meals at any time in the past 6 years. ↩
-
See the school level data in the Excel file of our official statistics for the last 2 inspection outcomes of all open schools, Ofsted, November 2018. ↩
-
‘Education and Adoption Act 2016’ and ‘Schools causing concern: guidance for local authorities and RSCs’, Department for Education, November 2018. ↩
-
Based on MATs that run at least 2 schools. Data was provided by the Department for Education and reflects the position in August 2018. ↩
-
Based on events completed by 31 August 2018 and published by 31 October 2018. See Ofsted’s reports site for the individual letters. Numbers include MATs which have since closed or changed name. Some early visits and visits to pilot new arrangements were not published and are not included in the numbers. ↩
-
Published as part of the ‘School inspection update: special edition’, Ofsted, September 2018. ↩
-
‘Off-rolling: using data to see a fuller picture’, Ofsted, June 2018. 19,000 pupils includes some pupils that remained in Year 10 the following year. ↩
-
The indicator of free school meals used is pupils in receipt of free school meals at any time in the past 6 years. ↩
-
By 1 April 2018, local authorities should have transferred all children and young people with statements of SEN to the new SEN and disability system who meet the criteria for an EHC plan. ↩
-
‘Special educational needs in England: January 2018’, Department for Education, July 2018, Table 1. ↩
-
An EHC plan details the support provided to a child or young person with SEND. It is drawn up by the local authority after an EHC needs assessment has determined that an EHC plan is necessary, and after consultation with relevant partner agencies. From 2015, the School Action and School Action Plus categories have combined to form SEN support. Extra or different help is given from that provided as part of the school’s usual curriculum. The class teacher and special educational needs co-ordinator (SENCO) may receive advice or support from outside specialists. The pupil does not have a statement or education, health and care plan. ↩
-
‘Special educational needs in England: January 2018’, Department for Education, July 2018, Main text. ‘Special schools’ combines state-funded and non-maintained special schools. ↩
-
Any registered independent schools that are not part of an association are inspected by the Independent Schools Inspectorate or the School Inspection Service. ↩
-
‘Special educational needs in England: January 2018’, Department for Education, July 2018, Table 11. Figures combine primary and secondary schools. ↩
-
Revised GCSE and equivalent results in England: 2016 to 2017’, Department for Education, January 2018, table Ch2b. ↩
-
‘Participation in education and training: local authority figures’, Department for Education, updated October 2018, table 5. ↩
-
‘Statements of SEN and EHC plans: England, 2016, May 2016 and Statements of SEN and EHC plans: England, 2018, Department for Education, May 2018, table 7. ↩
-
‘Statements of SEN and EHC plans: England, 2018’, Department for Education, May 2018, Main tables file, Table 1. ↩
-
‘Permanent and fixed-period exclusions in England: 2016 to 2017’, Department for Education, July 2018, Table 5 of the National tables. Table 6 also shows that the rate of permanent and fixed period exclusions are higher for pupils with ‘Social, emotional and mental health needs’ than for other types of need. ↩
-
A written statement of action is likely to be required where significant concerns are identified in relation to illegal practice or a failure to meet the duties under the Children Act 2004. It does not necessarily mean the whole service in the local area is failing. ↩
-
See Ofsted’s reports site for the individual letters for local areas that have been inspected. ↩
-
‘Alternative provision’, Department for Education, June 2016. ↩
-
Any registered independent schools that are part of an association are inspected by the Independent Schools Inspectorate or the School Inspection Service. ↩
-
However, the Department for Education clarified that it would consider an establishment that is open during the day and for more than 18 hours a week to be providing full time education. ↩
-
Since September 2012, any need for new, registered alternative provision is required to be met through the establishment of AP free schools, and local authority PRUs were also invited to convert to become AP academies. ↩
-
‘Schools, pupils and their characteristics: January 2018’, June 2018, Table 1B and 3A. ↩
-
August 2017 figure is based on the revised methodology ‘Changes to Ofsted’s statistical reporting of inspection outcomes for state-funded schools: an analysis of the changes’, Ofsted, June 2018. ↩
-
For further detail on inspection outcomes please see ‘Initial teacher education: inspections and outcomes as at 30 June 2018’, Ofsted, September 2018. ↩
-
‘Initial Teacher Training (ITT): accreditation withdrawal process’, National College for Teaching and Leadership, 2014. ↩
-
The other inspectorates that inspect the association independent schools are the Independent Schools Inspectorate and the School Inspection Service. ↩
-
Two schools that had a standard inspection did not receive an outcome for overall effectiveness and are excluded. ↩
-
A school is defined as a faith school based on whether they have declared a religious character, a religious ethos, or both. This information is updated by the school on Get information about schools. ↩
-
Three schools that had a standard inspection did not receive an outcome for overall effectiveness and are excluded. ↩
-
Four schools had not yet received an inspection since the introduction of the CIF, where the report was published by 30 September 2018, and are excluded. ↩
-
Two inspections are excluded because some parts of the ISS were incomplete. ↩
-
A school can be found not to comply with their registration agreement in one or more categories and so the totals for each type of change may not sum to the total number of non-compliant schools. ↩
-
Some referrals were received before the taskforce was set up. ↩
-
‘FE and skills learner participation by provider, local authority, funding stream, learner and learning characteristics: 2016 to 2017’, Department for Education, 2018. ↩
-
The inspections were carried out between 13 March 2017 and 9 April 2018, with reports published by Her Majesty’s Inspectorate of Prisons between 1 September 2017 and 31 August 2018. ↩
-
Further contextual information on providers is available in our ‘Further education and skills inspections and outcomes as at 31 August 2018’, Ofsted, 2018. ↩
-
For providers which began to be funded from April 2017 by the Education & Skills Funding Agency and/or through the apprenticeship levy. ↩
-
‘FE data library: local authority tables’, Department for Education and Education & Skills Funding Agency, 2018 ↩
-
See ‘Further education and skills’, Department for Education and Education & Skills Funding Agency for March 2017, 2017, November 2017, 2017 and March 2018, 2018. ↩
-
‘FE data library: local authority tables’, Department for Education and Education & Skills Funding Agency, 2018. ↩
-
‘16 to 19 allocation data: 2017 to 2018 academic year’, Education Funding Agency, 2017. ↩
-
‘16 to 19 allocation data: 2017 to 2018 academic year’, Education Funding Agency, 2017. ↩
-
This includes one 16 to 19 academy that was previously a school sixth form. It was judged outstanding under the schools 2012–15 inspection framework. It has yet to be inspected under the common inspection framework as a further education and skills provider. ↩
-
‘High needs funding: operational guide 2017 to 2018’, Education Funding Agency, 2017. ↩
-
‘Further education and skills: November 2017’, Department for Education and Education & Skills Funding Agency, 2017. ↩
-
Previously known as ‘learning and skills and work activities’. Includes 2 prisons that were inspected twice within the period. ↩
-
‘Estimates of the population for the UK, England and Wales, Scotland and Northern Ireland’, ONS, 2018. ↩
-
‘Characteristics of children in need: 2017 to 2018’, Department for Education, 2018. ↩
-
‘Children looked after in England including adoption 2017 to 2018’, Department for Education, 2018. ↩
-
Throughout the section when we talk about children in care and children looked after we are talking about the same groups of children. The terminology for them has changed from the SIF to the ILACS inspection framework. ↩
-
Full details of the end of the SIF programme can be found in the official statistics Local authority and children’s homes in England inspections and outcomes, Ofsted 2017. ↩
-
‘Independent inquiry into child sexual exploitation in Rotherham (1997 – 2013)’, Rotherham Metropolitan Borough Council, 2014. ↩
-
It should be noted that the children and young people themselves may be in care placements with providers that have a different overall effectiveness judgement than the LA itself. ↩
-
For the purposes of this comparison, children and young people in LAs that had not been inspected by 31 August 2017 are included in the judgement grouping that their LA would fall into after having an inspection later in 2017. ↩
-
The figure of 66 refers to all the monitoring visits that took place in the period. However, not all of the 66 visits have published reports, because a report is not published for the first monitoring visit each LA receives. ↩
-
The ‘front door’ in a social care context is the arrangement that local authorities have in place to respond to an initial contact from a professional or member of the public who is concerned about a child. At the front door, local authorities provide advice and make decisions about how they will act on information about the health, well-being and safety of children. ↩
-
Joint targeted area inspections (JTAIs) are inspections we carry out alongside the Care Quality Commission, HM Inspectorate of Prisons, and HM Inspectorate of Constabulary and Fire & Rescue Services. ↩
-
Two of these inspections took place outside the reporting period but have been included as they form part of the JTAI. ↩
-
‘Children looked after in England including adoption 2017 to 2018’, Department for Education, 2018. ↩
-
The majority of boarding schools are independent and belong to associations, which are members of the Independent Schools Council. As both education and welfare in these schools are inspected by their own inspectorate, Ofsted does not inspect these schools and so they are not included in the data. We inspect state funded boarding schools, where both education and the welfare of boarders are the subject of Ofsted inspection. We also inspect independent boarding schools which are members of the Schools Inspection Service and that receive their education inspections by these organisations and their welfare inspections from Ofsted. ↩
-
Further contextual information on social care providers is available in Children’s social care data in England 2018, Ofsted, 2018 ↩
-
‘Fees and frequency of inspection regulations – government consultation response’, Department for Education, 2017. ↩
-
‘Children looked after in England including adoption 2017 to 2018’, Department for Education, 2018. ↩
-
‘Fostering in England 1 April 2016 to 31 March 2017’, Ofsted, 2018. ↩ ↩2
-
‘Staying put: arrangements for care leavers aged 18 years and above’, DfE, Department for Work and Pensions and HM Revenue and Customs, 2013. ↩
-
This is a change in methodology from the one used to report on large organisations in the 2016/17 annual report. The 2016/17 annual report included LAs in the group of large social care providers. ↩
-
When we talk about new homes we are talking about brand new homes opened and not re-registrations of homes that were previously owned by the same organisation or by another organisation. ↩
-
When looking at changes in the number of homes opening or closing year on year, we have not included homes that have opened or closed since 1 April 2018. This is because two-thirds of children’s homes openings and closures take place in the second half of the financial year, so to include them could skew the data. ↩
-
‘Inspection profiles of the largest private and voluntary providers of children’s homes’, Ofsted, 2018. ↩
-
IFAs account for 43% of all mainstream fostering places. The other 57% are in LA fostering agencies. Fostering in England 1 April 2016 to 31 March 2017, Ofsted, 2018. ↩
-
When we talk about staffing qualifications, the data refers to 2017–18 staffing data and inspection outcomes. This is because children’s homes are inspected on an annual cycle that runs from 1 April to 31 March. ↩
-
Since 2014 all staff working in a home should have achieved a NVQ/Diploma level 3 within 2 years, unless working part-time, or if they have not worked in a home for a prolonged period. ↩
-
Registered managers of children’s homes are required, since 2014, to have a level 5 qualification or gain one within 3 years unless managing a home part-time, or if they have not managed a home for a prolonged period. ↩
-
These figures are based on a sample of 10% of all children’s homes inspected in 2017-18 looking at the education that children received. ↩
-
‘Social care questionnaires 2017: what children and young people told Ofsted’, Ofsted, 2018. ↩
-
Secure children’s homes accommodate children and young people who are remanded or have been sentenced for committing a criminal offence. They also accommodate those whose behaviour is deemed to present a significant and immediate threat to their safety or the safety of others, unless they are placed in a secure environment. Secure training centres accommodate young people between the ages of 12 and 17 who have been remanded or sentenced by the courts. ↩
-
‘Concerns and complaints about social care providers’, Ofsted, 2012. ↩
-
We regulate the following provider types; adoption support agencies, children’s homes, independent fostering agencies, residential family centres, residential holiday schemes for disabled children and voluntary adoption agencies. ↩
-
‘Social care: guidance for Ofsted staff’, Ofsted, 2014. ↩
-
Restriction of accommodation means a temporary restriction put on a children’s home to stop it accepting new residents. ↩